MySQL Query Optimization with Query Profiler
Query Profiler generates profiling results that can help you analyze and maximize query performance in MySQL and MariaDB databases. The tool allows you to collect detailed statistics about executed queries, reveal and force slow queries and troubleshoot performance issues.
Query Profiler, built into dbForge Studio for MySQL, is the best query optimization tool to tune MySQL queries and investigate query performance issues in an efficient and fast way. It helps build up a picture of how the queries are run to access data and what operations impact your application.
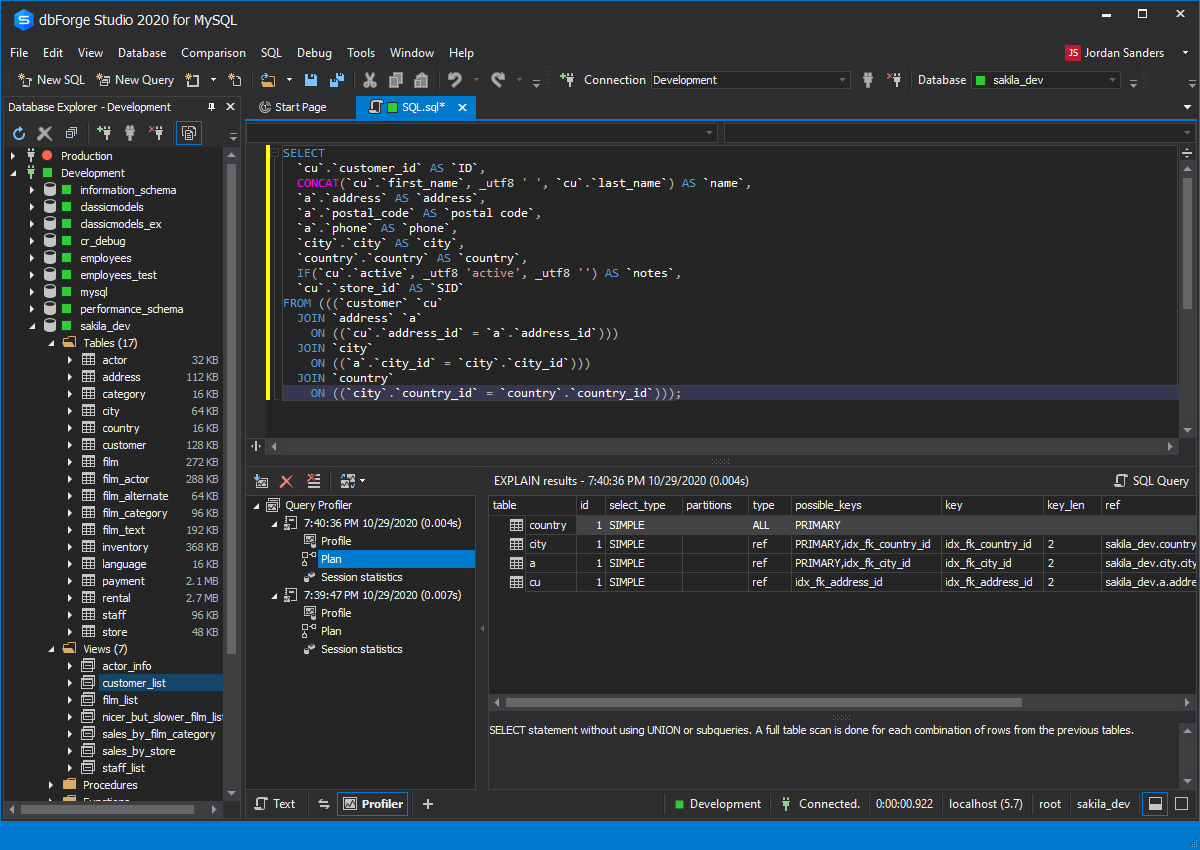
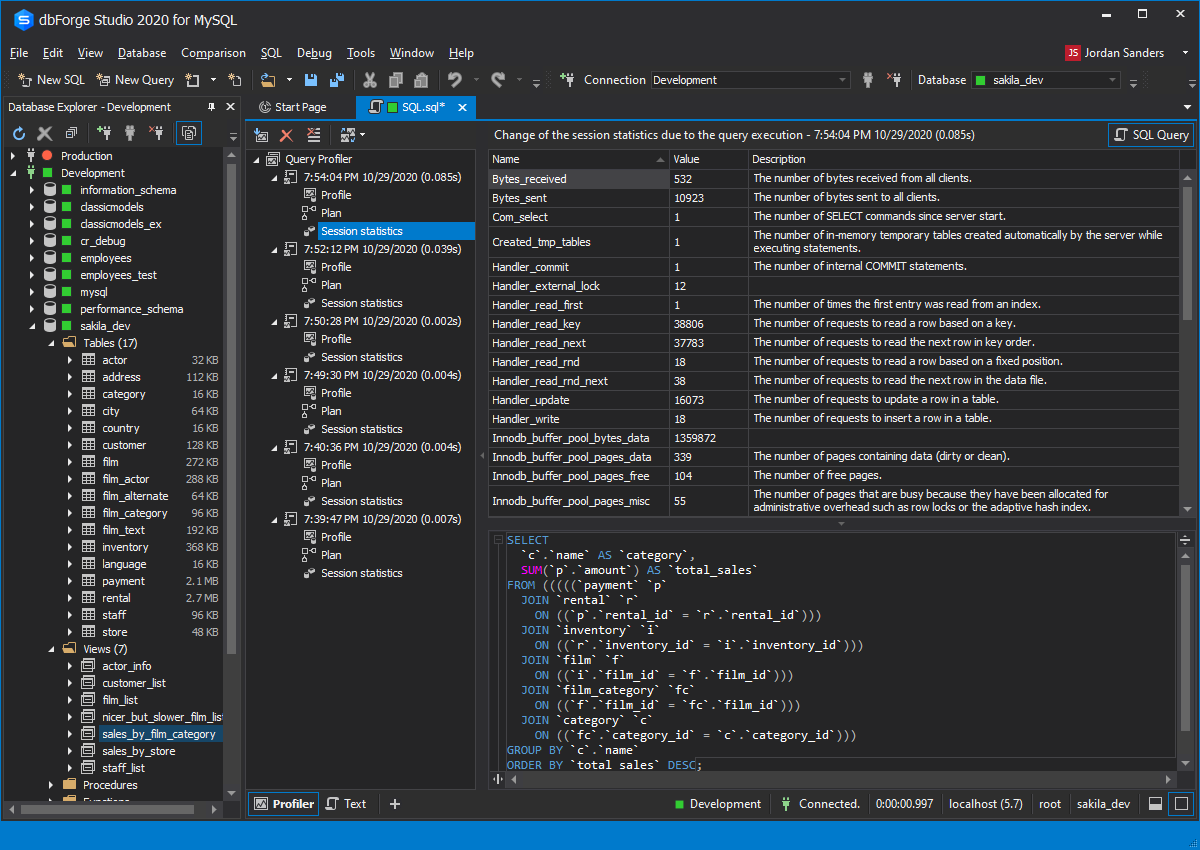
- View the EXPLAIN plan and profiling results, and monitor session statistics
- Save time on detecting bottlenecks in your queries
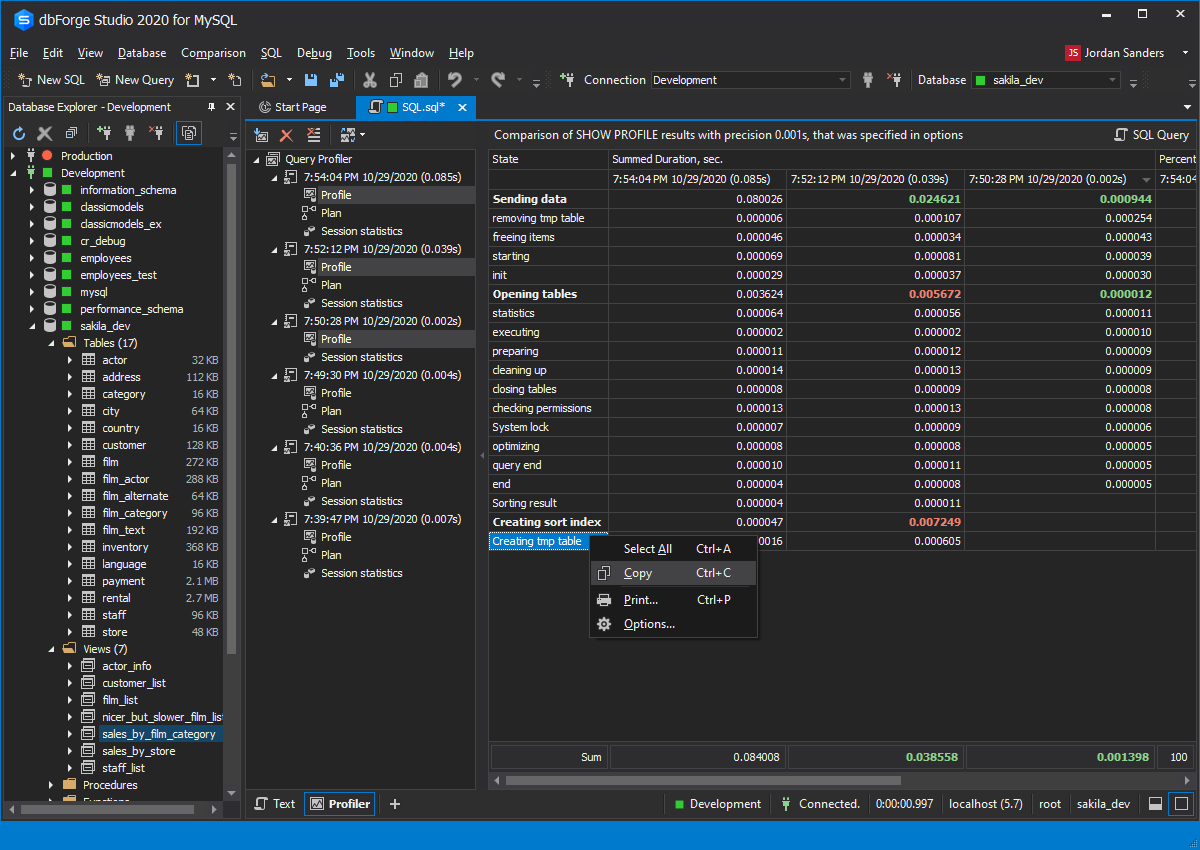
- View time delays at different stages of executing a query
- Compare differences in query profiling results visually
- Get a clear and automated way to profile your database queries
- Fetch MySQL query data faster
- Trace MySQL queries and diagnose performance issues with slow queries