Analyze Traces to Increase SQL Server Performance
dbForge Studio for SQL Server profiling feature is a powerful GUI and performance monitoring tool designed to capture events on a SQL Server database instance and trace server activity. The tool collects
locks, batches, statements, error information, wait statistics, details about server activity and query execution, and then writes trace results
to a file. You can later use the file to analyze and optimize SQL Server performance and troubleshoot server-related issues. dbForge SQL Server Event Profiler
helps profile server events, start, stop, or modify the trace results per your needs, select actions and columns to be captured during the event session,
and define data filtering options.
- Detect and tune the extensive resource-consuming queries
- Control SQL Server resource consumption load activity
- Diagnose slow-running queries and poor performance issues
- Use multiple event profiling templates to capture and analyze server events
- Trace activity of SQL Server Database Engine, Analysis & Integration Services
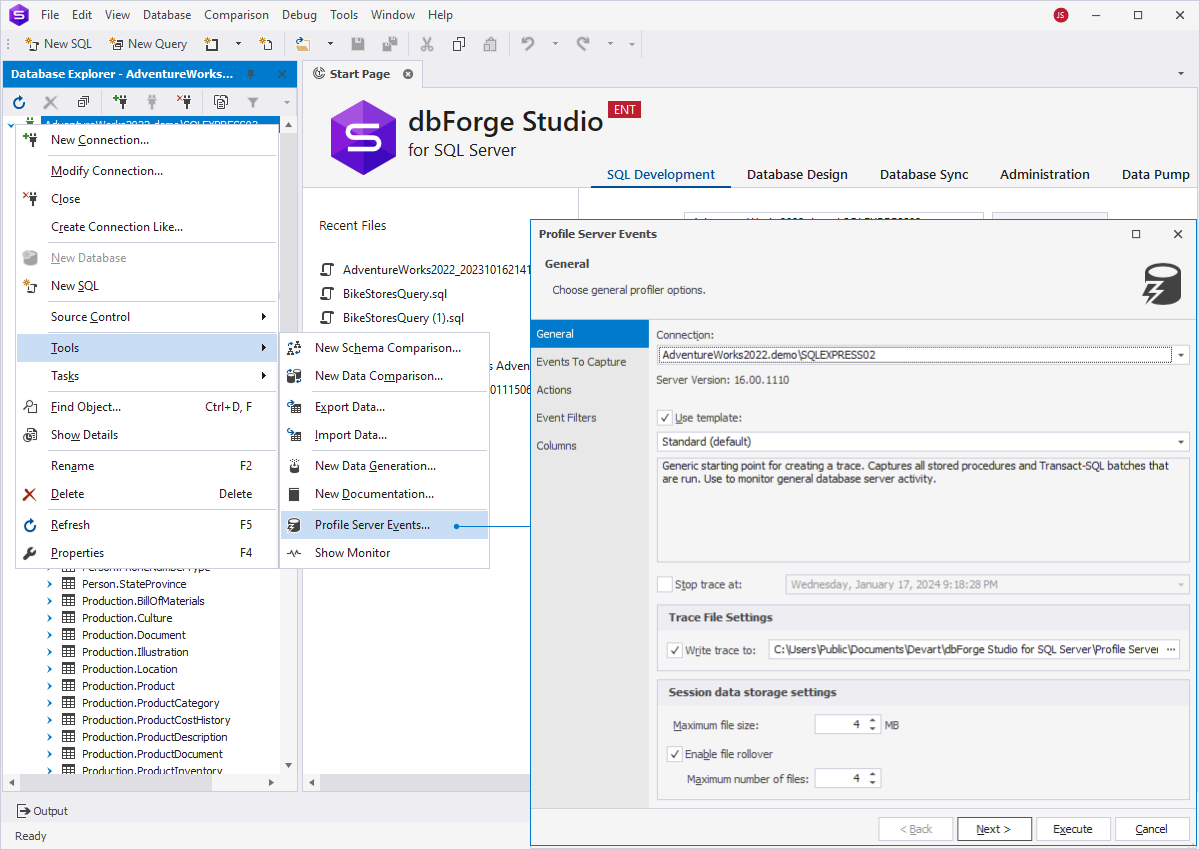
Setting up the Profiling of Server Events
With the Profile Server Events wizard, you can quickly start tracking events and customize the
current profiling session up to your needs. You can use a predefined set of templates from the following categories:
Locks and Blocks, Query Execution, System Monitoring, and Trace System. For example, the Standard template is set as default.
You can use it if you want to run tracing with default settings of all stored procedures and Transact-SQL batches or use it as a generic starting point
for creating a trace.
On the Profile Server Events > General tab, you can use the following options to create a trace:
- Select or modify a server connection, or create a new one
- Specify the date and time to stop the trace
- Indicate a path to the profiler data file (.pdt) that will store the trace results
- Set the maximum storage size for a trace file
- Enable the file rollover to create a new file when the maximum file size is reached
- Monitor actions, stored procedures, and T-SQL statements and batches from your previous sessions
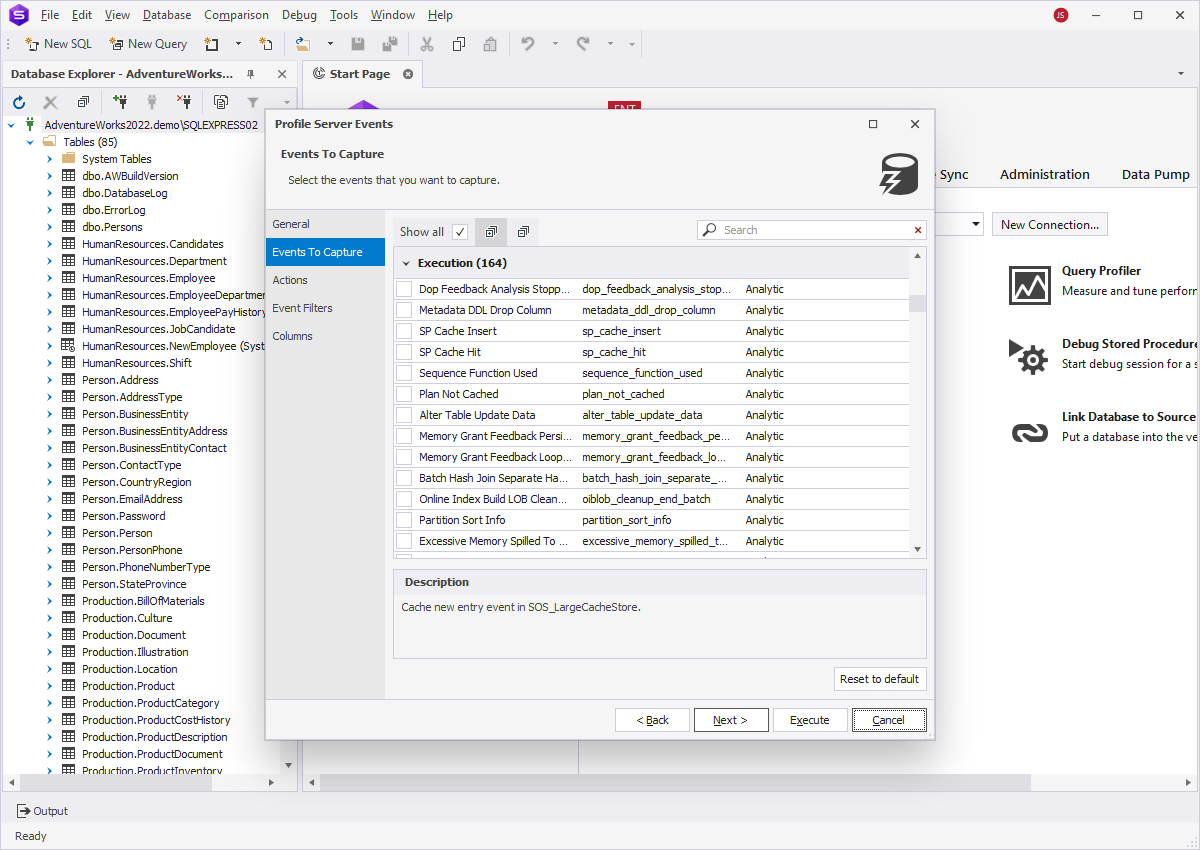
Capturing Server Events
After you have selected a trace template and customized trace file and data storage settings for the current session,
you can proceed with defining events you want to be tracked and analyzed in a trace session. The tool offers a huge collection of events grouped
by a category with the number of events it includes and with a specific action type, such as Analytic, Debug, Operational, and Admin.
To view the full list of available events, select the Show all checkbox. To select the events, expand the category
and select the corresponding checkboxes.
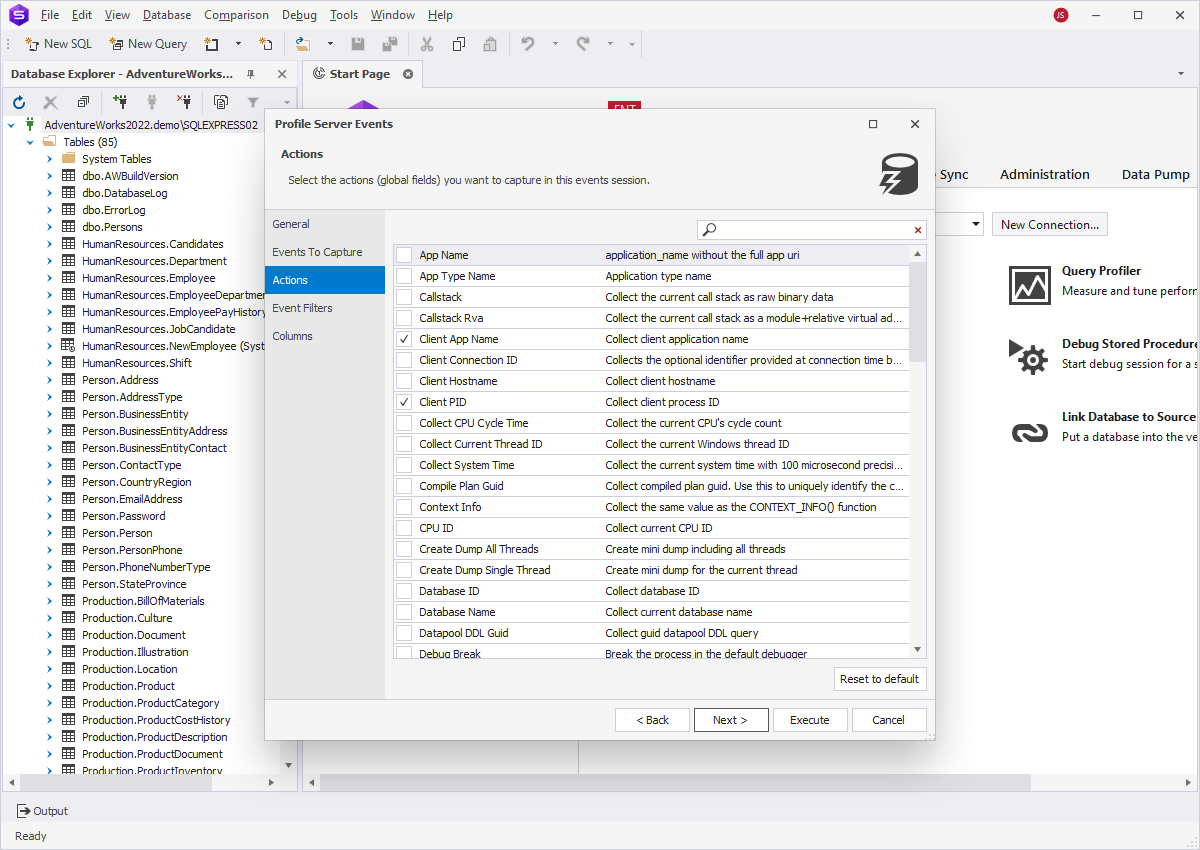
Defining Actions for Captured Events
After you have decided on the list of the events you want to trace, you need to set the actions to be performed towards
the events in the current trace session.
On the Profile Server Events > Actions tab, you can use the following options:
- Select the actions to capture in a trace event session
- View the explanation what information this specific action collects.
- Search for the action on the list
- Reset the options to the default settings
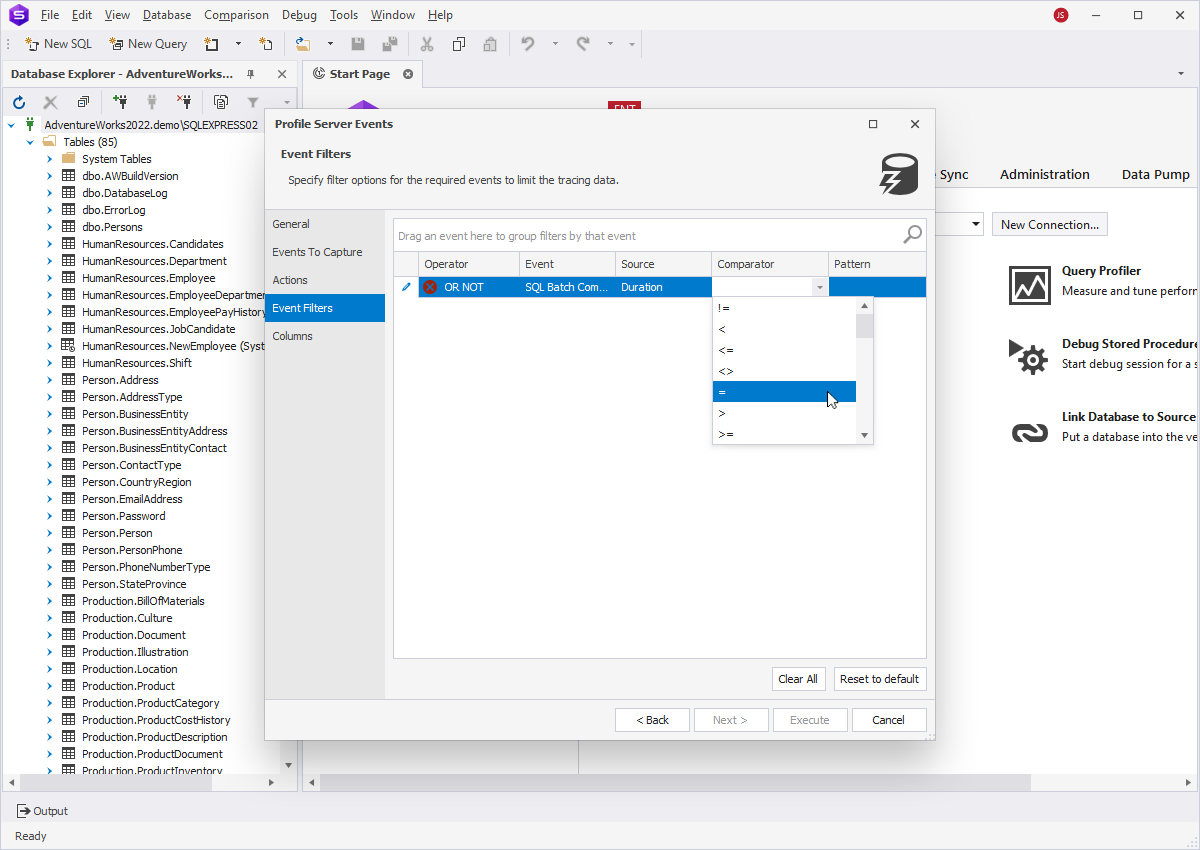
Filtering Captured Events
To simplify the analysis of tracing events and collect events according to your purposes, you can set filters on the Profile Server Events > Event Filters tab. Otherwise, the trace will output
all the data rows matching your profiling conditions during the current session. You can apply filters for a group of events you chose on the Events to Capture tab by selecting the following
options from the drop-down menus: operator, event, comparator, source, and pattern.
On the tab, you can also remove the filters by clicking Clear all or reset to the default profiling options.
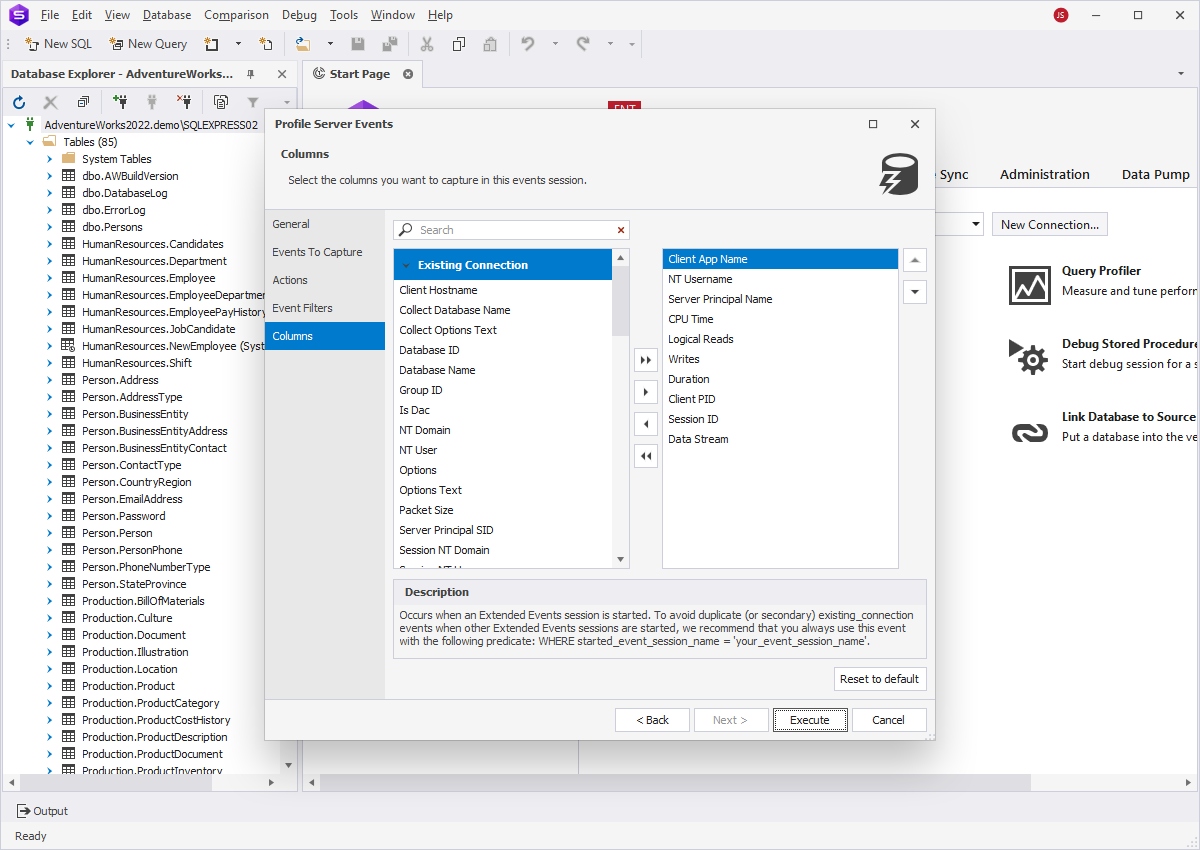
Profiling Column Properties for Captured Events
To control the scope of the trace results in the session, you can specify the columns to be captured in the current event session. On the Profile Server Events > Columns tab,
there is a list of columns grouped by the category depending on the events you chose on the Events to Capture tab. With the
arrow options, you can add columns to the trace one by one or in bulk.
When you configured all the options to launch the trace, you can click Execute to complete the process. SQL Server Event Profiler starts capturing
the events for the current event tracing session by applying the filters and display the trace results on the grid.
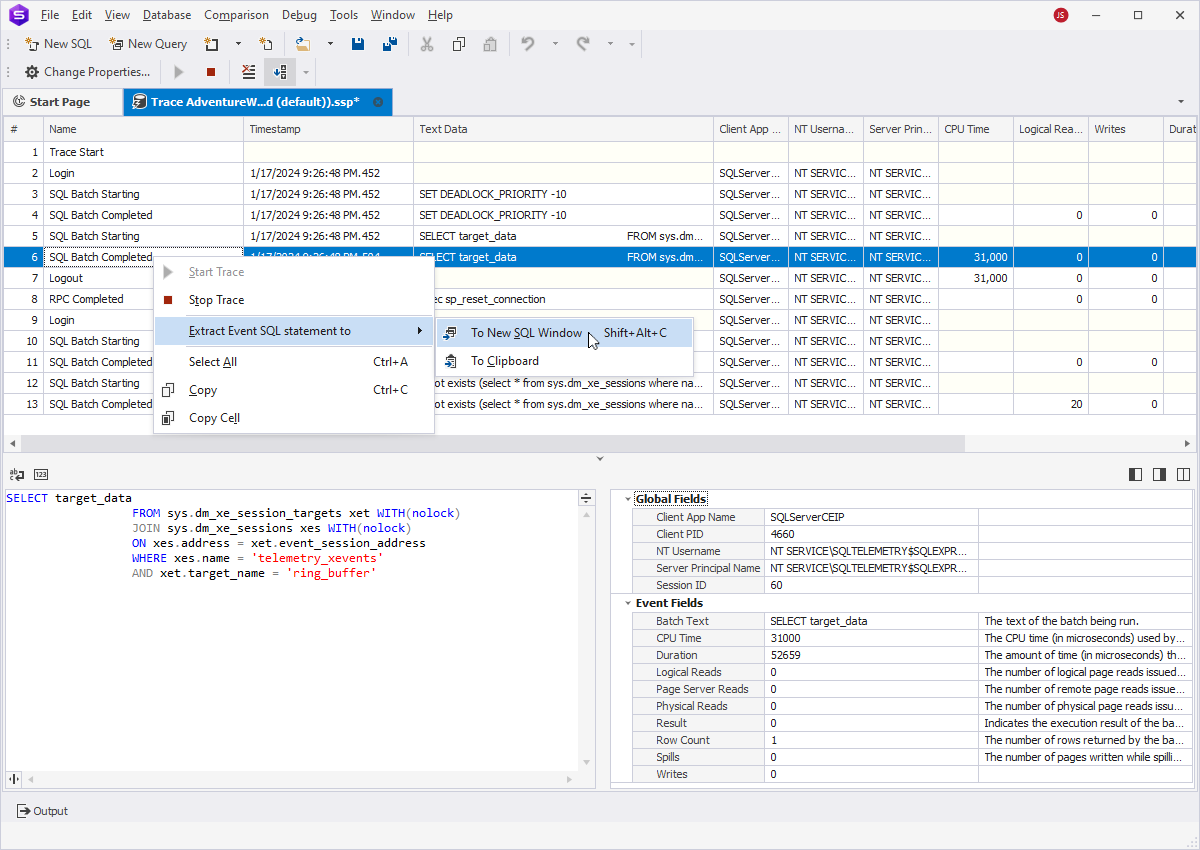
Analyzing Traces
SQL Server Profiler Document represents a list of all server events that meet the selected criteria
and provides a wide range of options to highlight and monitor the most questionable events. You can:
- Manipulate a SQL instance on the background and immediately see traces in the document
- Stop/start tracing anytime
- Select several most significant events for a detailed analysis
- Filter and group events in the grid
- View detailed information about each event, including SQL code
- Extract event to a new SQL window or to clipboard