Profile LINQ Easily with LINQ Insight!

True ORM Profiler

ORM application interaction with database

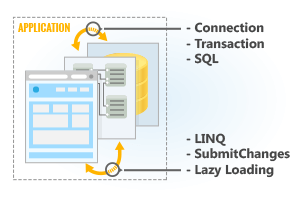
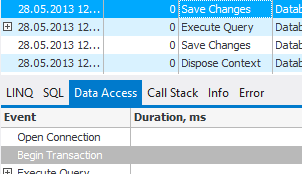
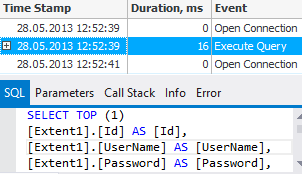
Applications, using ORMs to access data usually don't interact with database directly. Instead they interact with ORM run-time - query entities via LINQ, work with them, and then post modified entities via SaveChanges (or SubmitChanges). ORM runtime, in its turn, interacts with the database - opens connections, queries and updates data via SQL, etc.

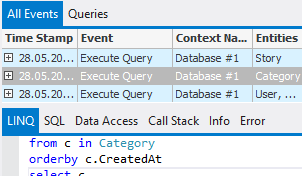
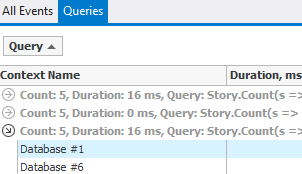
Most profilers show just the interaction with the database - SQL statements execution, database connecting, etc. LINQ Insight offers true ORM profiler - it allows you to really profile the interaction between applications and ORM! With our LINQ Profiler tool you can see how much time LINQ statement or SubmitChanges call takes to execute as a whole even if it generated multiple SQL statements. You profile exactly the code you write and study the real performance of your LINQ code.

Moreover, there is no need to modify your project at all! Just open the LINQ Profiler window and click the Start profiler session button on its toolbar. Then run your project and get real-time data on ORM events in the LINQ Profiler window.

Multiple ORMs Supported

LINQ Insight supports the following ORMs:

Profile ORM Calls

With our LINQ Profiler tool you can see the details of such ORM calls as context creating and destroying, LINQ queries, SaveChanges calls.

ORM events info

See Related Data Access Events

LINQ Profiler enables you to see which data access events are caused by any specific ORM call. This allows you, for example, to easily find LINQ data access antipatterns that generate a large number of SQL commands for a single query.

Viewing specific data events

Data Access Events View

Study the generated SQL command performance, transactions, connection opening and closing with the Data Access Events view, similar to other ORM profilers. You can easily navigate between a data access event on this view and the corresponding ORM call on the ORM Events view.

Data access events info

Queries View with Summarized Information

Queries view allows you to easily find the situations when a query is used too often and it may be better to cache its results than to use it each time. It allows you to group the executed LINQ queries by query text, calling thread, or the context used and see the total number of queries in each group and total time these queries took to execute.


Queries view

Object Tree

ORM calls can be easily filtered by the calling process or context with the Object Tree window. Just select the corresponding context or process node.

Object Tree

Call Tree

Call Tree window is a powerful tool for filtering the profiler information by the calling method. It displays the tree, created by merging all call stacks of ORM calls.

Call Tree