General Guide to PostgreSQL Performance Tuning and Optimization
PostgreSQL is an advanced open-source relational database known for its flexibility, reliability, variety of features, integrity, and performance. It can be installed on multiple platforms, including web and mobile.
Though the PostgreSQL default configuration is tuned for any environment on your machine, still, it is recommended to optimize some settings to achieve higher and effective performance specific for your software and workload.
The article covers performance tuning and optimization tips that may help you improve query performance in PostgreSQL.

PostgreSQL hardware optimization
While monitoring PostgreSQL performance, database administrators can detect and analyze information or performance issues and search the ways to optimize them. For example, PostgreSQL big data or retrieval of millions of rows may drastically impact performance, so optimization, in this case, can be crucial for effective performance. However, when writing queries, developers should take into account hardware capacity, table partitioning, index usage, configuration parameters, etc.
First, they should analyze the hardware configuration you use.
RAM
The more memory you have to store data, the more disk cache, less I/O, and better performance you receive. For example,
if you consume more memory than you have, you may get the 'out-of-memory' errors in logs or have running processes terminated
to free up more space. Thus, it may be worth increasing memory for proper work without disruptions.
Hard disk
When it comes to hard disks, it is critical to monitor disk usage and its parameters, and analyze how you can configure them for the PostgreSQL server to run efficiently.
Slow response time may cause poor performance. If the application is bound to input/output operations,
the faster drive in this case will be a good choice to improve performance. Using separate drives or tablespaces for different operations, for example, with data or indexes,
may also solve any performance issues that may arise.
CPU
PostgreSQL efficient performance greatly depends on CPU usage. Complex operations such as comparison, table joins, hashing, data grouping and sorting
require more processor time. If you work with large databases,
CPU speed may either make performance worse or better. CPU capacity increase may require more costs.
So you should thoroughly analyze the CPU usage and operations running on the server.
Perhaps, if CPU does not cause poor performance or you may achieve better performance with other metrics,
such as RAM increase, those parameters might be upgraded.
Tuning the operating system
Hardware improvement is unhelpful if your software is not able to use it and results in a waste of your time, costs, and resources. Thus, tuning the operating system should also be taken into consideration.
PostgreSQL query performance greatly depends on the operating system and file systems it is running on. For example, with the Linux operating system enabling huge pages available in this operating system can improve PostgreSQL performance, while disabling data files will save CPU cycles.

Configuration parameters tuning
Configuration parameters may have a significant impact on database performance and resources usage in PostgreSQL. To optimize performance for your workload, you can customize the parameters in the $ PGDATA / postgresql.conf file. Let's overview the commonly-used parameters:
max_connections
Sets the maximum number of database connections open simultaneously on the PostgreSQL server.
It is not recommended to set many connections at the same time, because this may impact memory resources
and increase the size of Postgres database structures.
shared_buffers
Determines the amount of memory to be used for shared memory buffers on the database server. As a rule, it is optimal
to use 25% of the available RAM so that it cannot make performance worse. However, you can try to set another threshold to test
whether it can be applicable to your workload.
effective_cache_size
Determines the total amount of memory for caching data per query. This parameter
may influence the usage of indexes. The higher the value is, the more likely the index scan will be applied.
With the lowest values, the sequential scan will likely to be used.
work_mem
Sets the amount of memory to be used for internal sort operations and hash tables before temporary files are used on disk.
If you want to increase this parameter, keep in mind that it will be used per operation. Thus,
if there are multiple operations running simultaneously, each operation will use the specified memory volume.
fsync
When enabled, the server records the changes physically to disk, for example, by executing the fsync() system calls.
This prevents data loss or corruption and ensures database consistency in the case of a hardware or operating system failure.
commit_delay
Sets the delay in microseconds between committing the transaction and saving WAL to disk. This parameter
can improve performance when multiple transactions are committed during the current operation.
random_page_cost
Allows the PostgreSQL optimizer to estimate the cost of reading a random page from disk and decide on the
usage of index or sequential scans. The higher the value is, the more likely sequential scans will be used.
Reporting and logging
With the help of logs and error reports, you can analyze how the application works or which errors occur when performing a specific operation. In addition, you can tune database performance with logs enabled on the queries. To scan and get a deeper understanding of any potential performance issues that may arise, let's look at some log parameters:
- logging_collector: When enabled, records the output into log files.
- log_statement: Controls which SQL commands should be logged. You can set to ddl to log structural changes to the database, to mod to log data changes, and to all to log all changes.
- log_min_duration_statement: Detects slow queries in the database. When enabled, the duration of all commands will be recorded, however, I/O capacity will be increased.
- log_min_error_statement: Records failed SQL statements to the server log.
- log_line_prefix: Sets the format of the database logs. It can be used to improve readability.
- log_lock_waits: Identifies slow performance and lock waits due to locking delays.
VACUUM processing in PostgreSQL
VACUUM is considered to be one of the most useful features in PostgreSQL. The VACUUM processing is an operation that cleans updated or deleted rows to recover or reuse free disk space for other operations. Vacuuming is configured and enabled by default in PostgreSQL. However, you can customize settings to meet your business goals and workload, or improve performance. The more frequently you perform vacuuming, the better database performance might be.
DBAs can execute either VACUUM that can be run in parallel with other database operations or VACUUM FULL that requires an exclusive lock on the table to be vacuumed and cannot be done with other operations. The latter overwrites the table in a new disk file leaving available disk space for the operating system. That's why this type is executed much slower. Thus, for routine operations, it would be better to use VACUUM.
Also, database administrators can execute the VACUUM ANALYZE command that first performs a VACUUM operation and then executes an ANALYZE command for the selected table. The ANALYZE command collects statistics to identify the most efficient and optimized way to execute the query.
Finding slow queries
To tune database performance and detect PostgreSQL slow and inefficient queries, you can examine the query plan by executing PostgreSQL EXPLAIN and EXPLAIN ANALYZE commands.
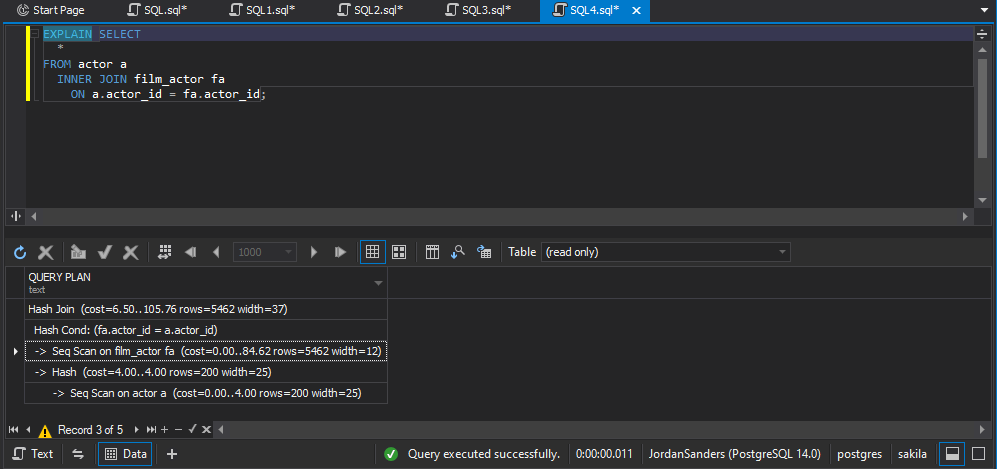
EXPLAIN
Allows you to view the generated explain execution plan for each SQL query without running it.
The plan has a hierarchical structure of the tree plan nodes. The plan displays how it scans the table in the query.
In the plan, you can view estimated startup cost, the total cost required to process the execution, the number of table rows and their average width
returned in the result. In addition, the plan calculates the average time required to execute the query.
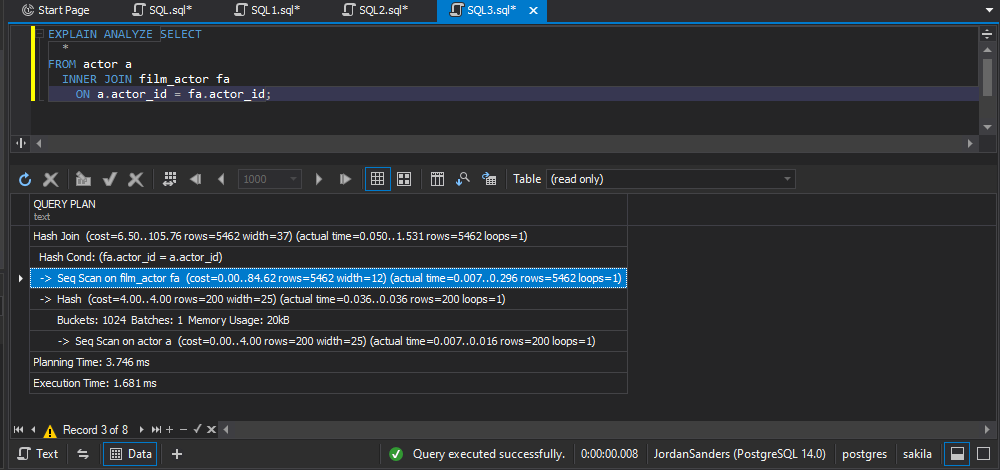
EXPLAIN ANALYZE
Allows you to profile each SQL query running in your application and see the result of how the query is actually processed. This command
executes the query and then outputs statistics, the actual row count, planning, and execution time along with the same estimates as a standard EXPLAIN command.
In general, both commands help you analyze how queries are executed and find the most optimized way, which you can use to rewrite the queries and adjust them to be more efficient.
Database design
Sometimes database design may lead to slow performance, especially when dealing with large tables. For PostgreSQL database performance optimization and I/O improvement, you can partition large volumes of data into small ones, thus, splitting a single table into several separate logically-joined tables. The main table will store information which you will access frequently, and other tables will keep additional information.
Besides, you can create partial indexes for columns, which you often use. This may accelerate query performance. However, you should be careful with indexes, because their excessive usage may decrease performance.
Analyzing PostgreSQL performance opportunities
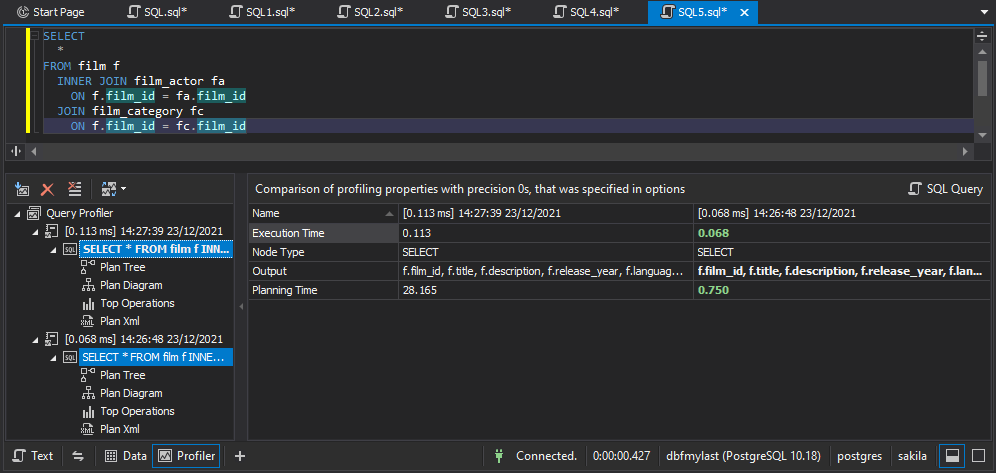
For performance optimization and tuning in PostgreSQL, the Devart team developed dbForge Studio for PostgreSQL, a powerful GUI tool that has an advanced built-in PostgreSQL performance analysis tool - Query Profiler. It is a visual query analyzer designed to optimize and tune the performance of slow running queries and to detect bottlenecks that may worsen performance.
The PostgreSQL Profiler tool enables you to:
- Analyze and troubleshoot performance issues
- Compare query profiling results by viewing their differences on a visual dashboard
- Examine an execution explain plan to improve performance of slow-running PostgreSQL queries
- Get a deep understanding of all operations by analyzing metrics on the plan diagram
- Check the most expensive operations on the top operations list
- Share the plan in the .xml format
Conclusion
Analyzing PostgreSQL query performance is critical for efficient work of databases and data retrieval. Using the above-mentioned performance tips and practices may help you not only improve database performance but also identify slow queries, tune and optimize index performance, speed up PostgreSQL queries, and examine issues that may cause poor performance.