
Using dbMonitor
To extend monitoring capabilities of dotConnect for Oracle applications there is an additional tool called dbMonitor. It is an easy-to-use tool to provide visual monitoring of your database applications. dbMonitor can be used for any kind of applications - desktop, ASP.NET and windows services.
dbMonitor performs per-component tracing of database events such as commit, rollback, SQL statement execute etc.
dbMonitor has the following features:
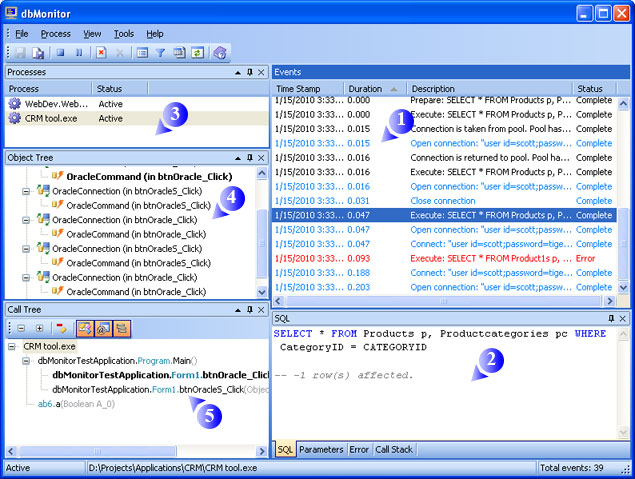
1. Events grid
Events grid displays you all the traced database events. It provides brief description, timestamp, duration, and event status. Below the grid four windows are docked in the group: SQL, Parameters, Error, and Call Stack. They display information about the event, currently selected in the Events window. You may click the header of the events grid columns to sort the events by the clicked column.
2. Event details
This group of four windows includes:
- The SQL window displays the SQL statements for the database event, selected in the Events window, if the event is an execution of SQL code.
- The Parameters window displays the SQL statement parameters for the database event, selected in the Events window, if this event is an execution of SQL statement, containing parameters.
- The Error window displays information resulted in error.
- The Call stack window displays call stack of the function, that started the event.
3. Processes window
This window displays list of monitored processes and their status. It allows you to choose what process to trace. Events grid displays events only for the selected process. After process application is closed, it has Terminated status, but its event log is not cleared, you can still view their information or save it to file. To remove terminated process from the list, either right-click it and select Delete Inactive from the popup menu, or click it and then click the Delete Terminated Process button on the toolbar.
4. Object tree window
This window below the Processes window displays monitored objects. Objects are combined in a tree with top level All Objects node, second level connection object nodes, and third level object nodes. Object Tree also contains 'Pools' node to group connection pools. It allows you to view events for all process objects, for specific connection, or for specific object. Just click the node to trace events for this node and its descendants.
5. Call tree window
It contains merged call stacks of the database events for the process. You can use it to filter events by functions, that started them. Just click the function in call stack tree, and Events window will display only events, called from that function or its descendants.
Remote debugging
To use remote debugging for your applications, you should set the following properties:
- OracleMonitor.Host - to the name or IP address of the computer, where dbMonitor will be used.
- OracleMonitor.Port - to the port, that will be used for communicating between dbMonitor and your application.
Then in dbMonitor options you should set the same port value on the General tab of the Options Dialog Box. After this you may run your application and monitor database calls.
Unicode support
You can monitor applications using international databases by help of the Unicode support.
During monitoring you can easy switch between client processes and view hierarchy of objects being traced.
dbMonitor is intended to hamper application being monitored as less as possible.
Monitoring is accessible at design-time as well.
To trace your application with dbMonitor you should follow these steps:
- Create an instance of OracleMonitor component in your application. You can do it by dropping OracleMonitor on form from toolbox or by creating it manually in code. Only one instance of OracleMonitor is needed in the application.
- Set OracleMonitor.IsActive property to true to enable monitoring.
- Start dbMonitor application before running your program. If dbMonitor is installed you can start it from OracleMonitor component designer by clicking "Run dbMonitor" verb or from the Oracle submenu of the Tools menu.
Optional. To trace your application remotely with dbMonitor you should follow these steps:
- Perform the steps defined above.
- Set OracleMonitor.Host property to the name of the station where dbMonitor is running.
- Set OracleMonitor.Port property to port number of the dbMonitor application (1000 by default).
- Run dbMonitor application and start tracing.
Note: dbMonitor utility is available with dotConnect for Oracle Professional and Developer Editions only.