
Reports Generator and Reporting Tools for MySQL Databases
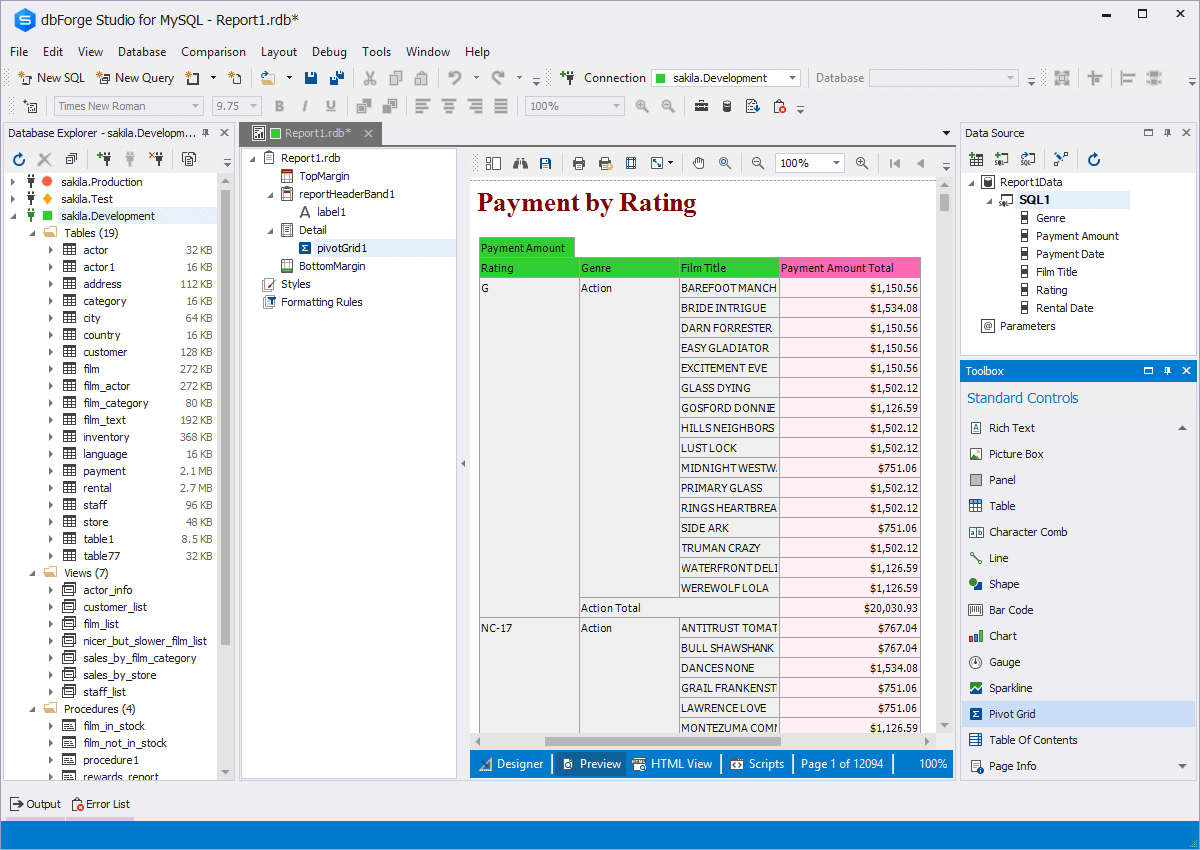
Streamline your work with multi-dimensional data, visualize data trends and dependencies, make quick but reasonable business decisions, convert your data into professionally-looking pivot tables.
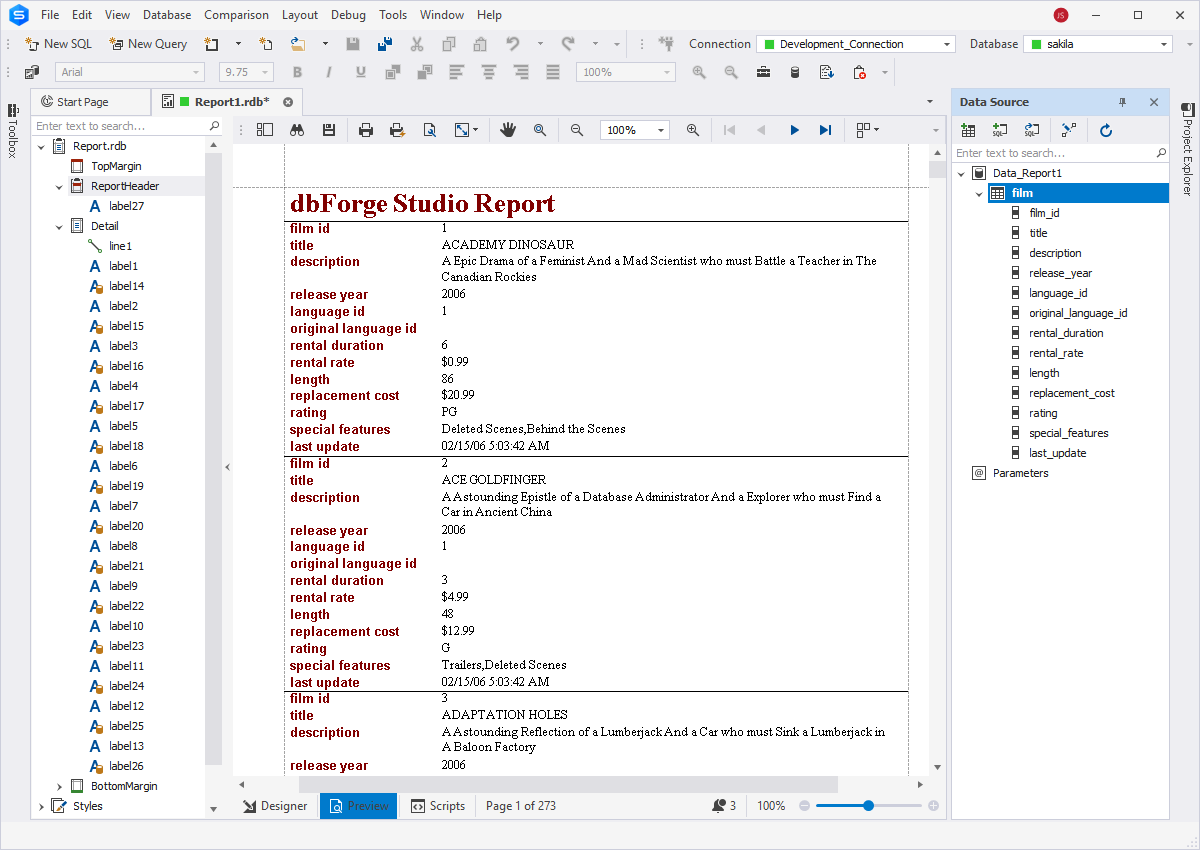
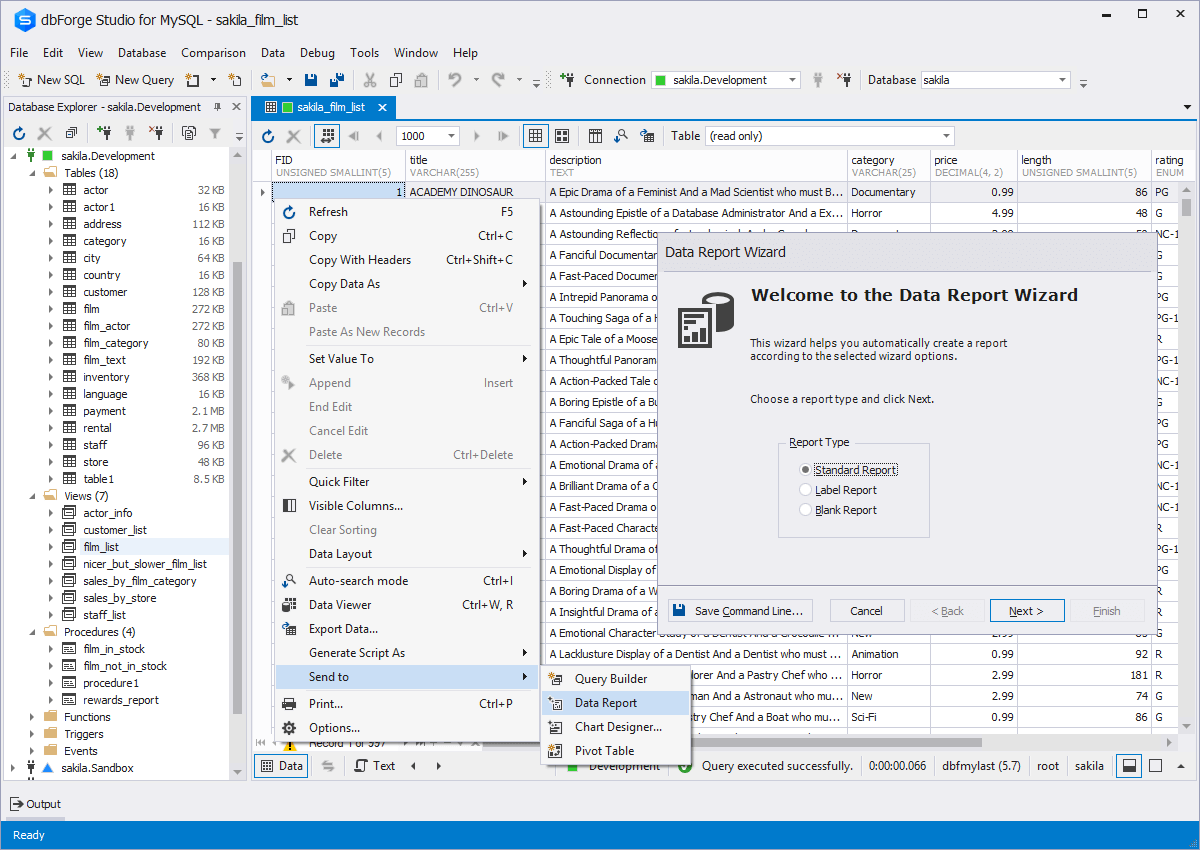
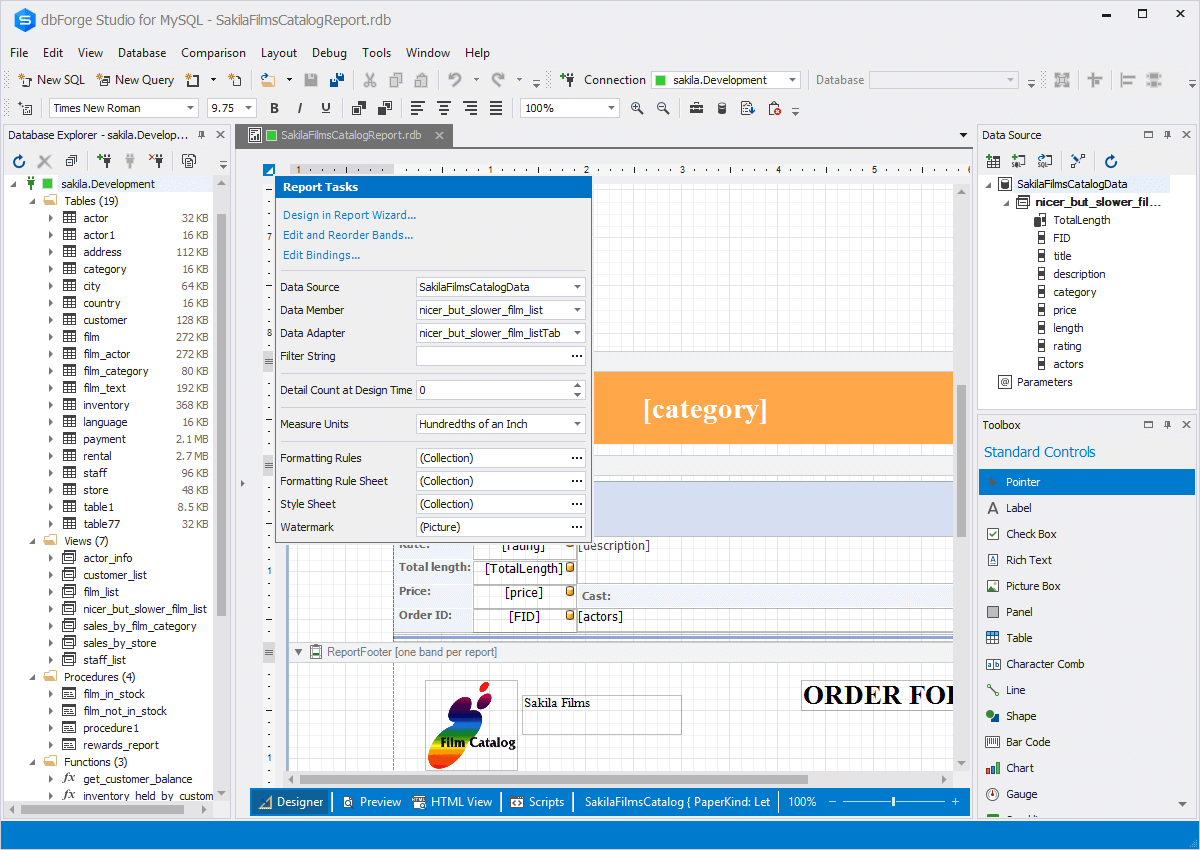
Design any data reports with parameters, customizable formatting, and calculated summaries within minutes using the MySQL reporting tool provided by dbForge Studio for MySQL. It makes data analysis and visualization far less time-consuming with the following features:
- Data Report Wizard
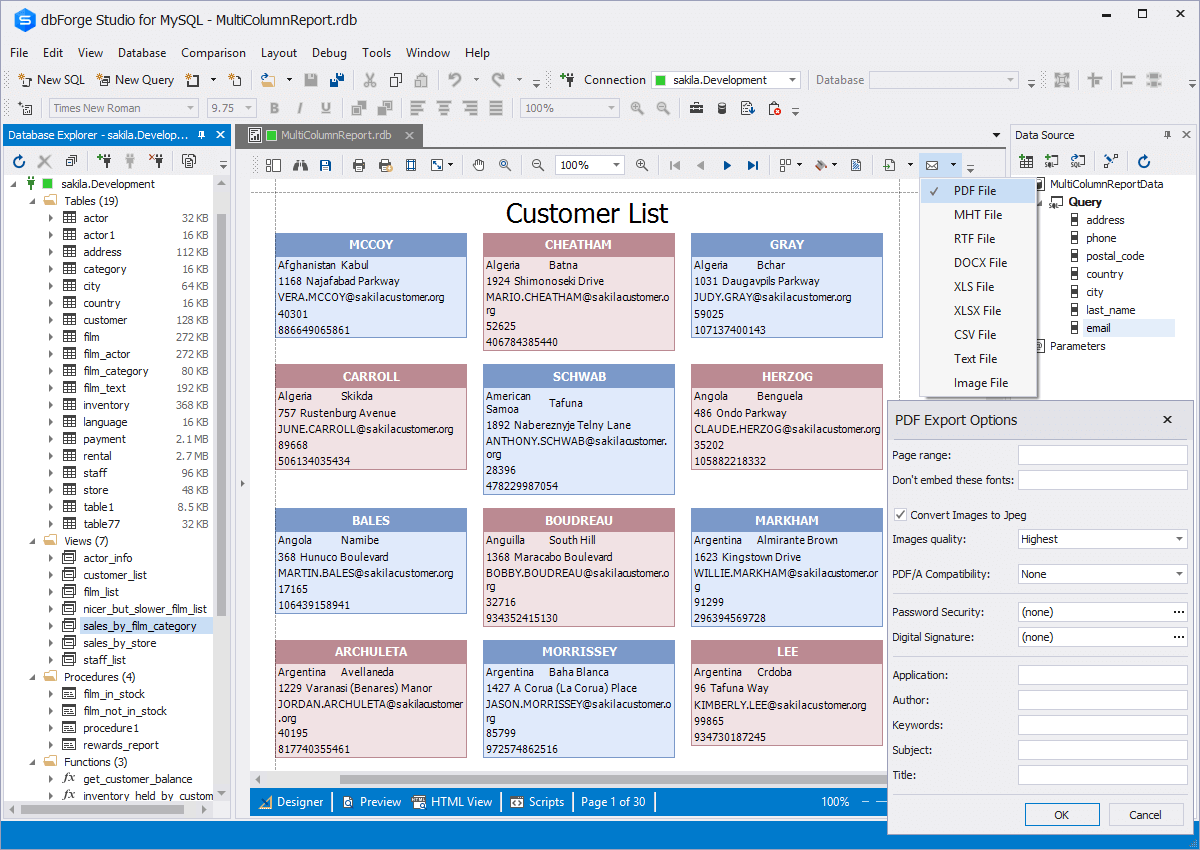
- Report designer
- Pivot tables
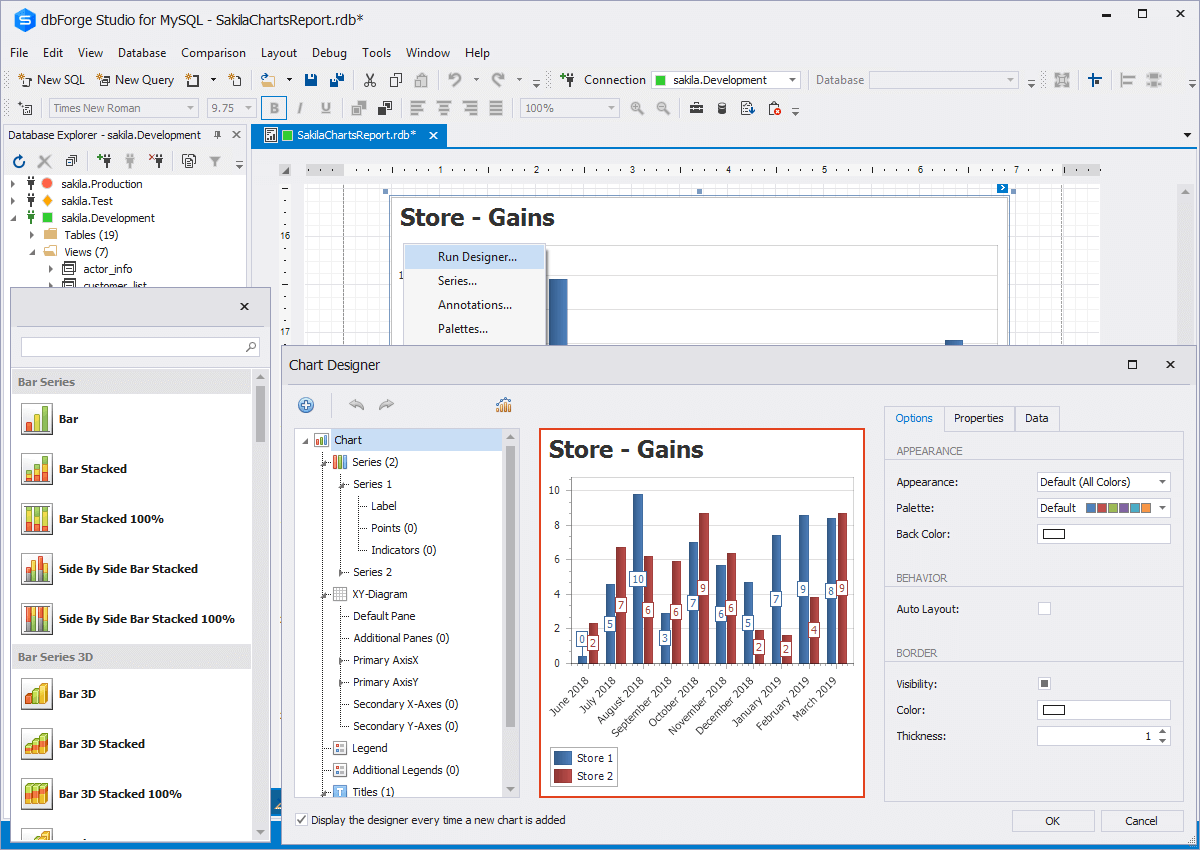
- Chart designer
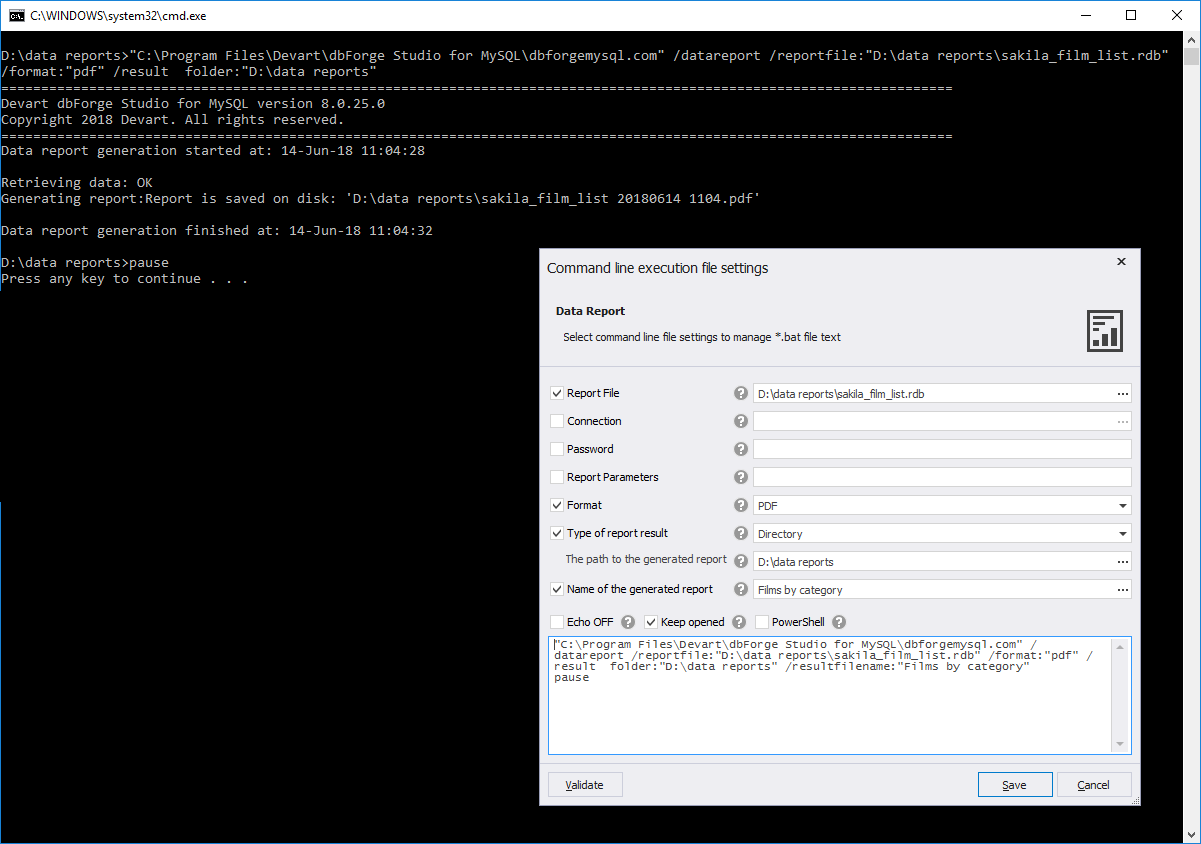
- Command line support
- 9+ formats for importing ready reports

 dbForge Studio