Optimize Queries with Oracle SQL Profiler

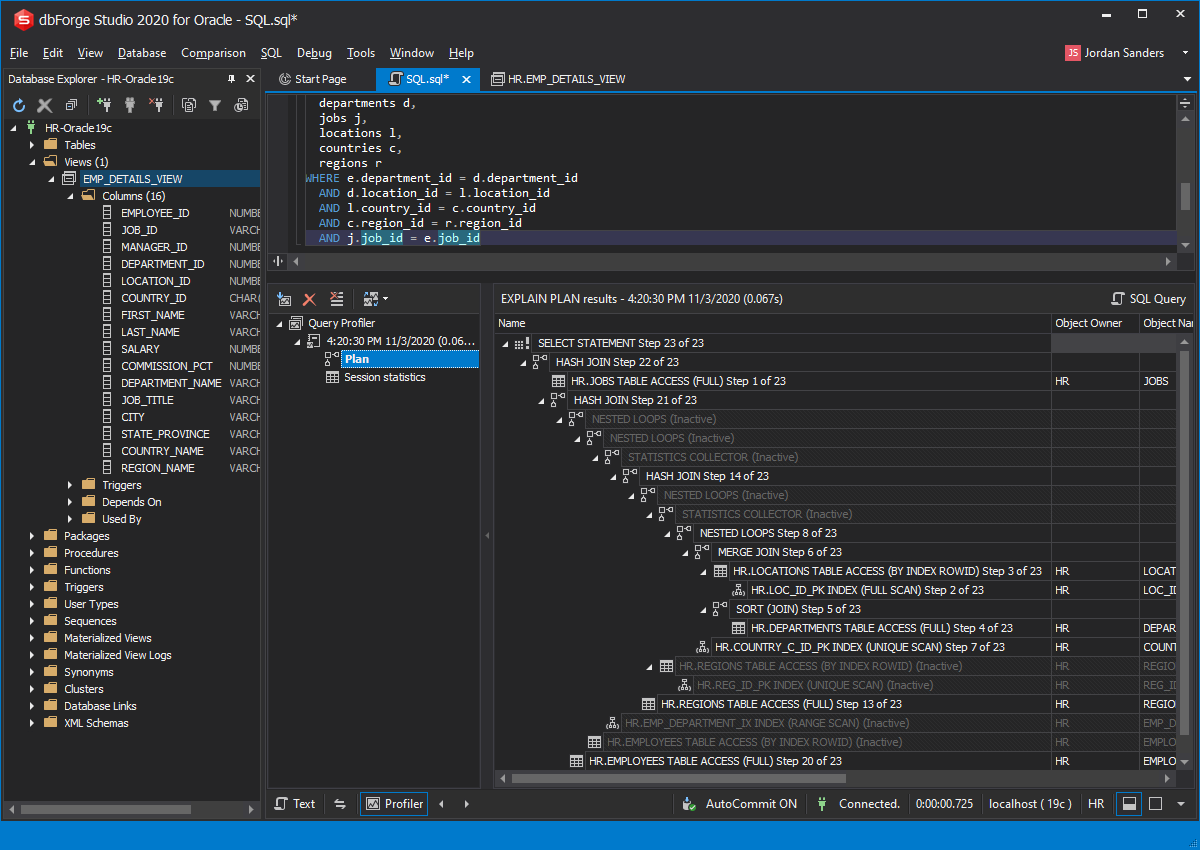
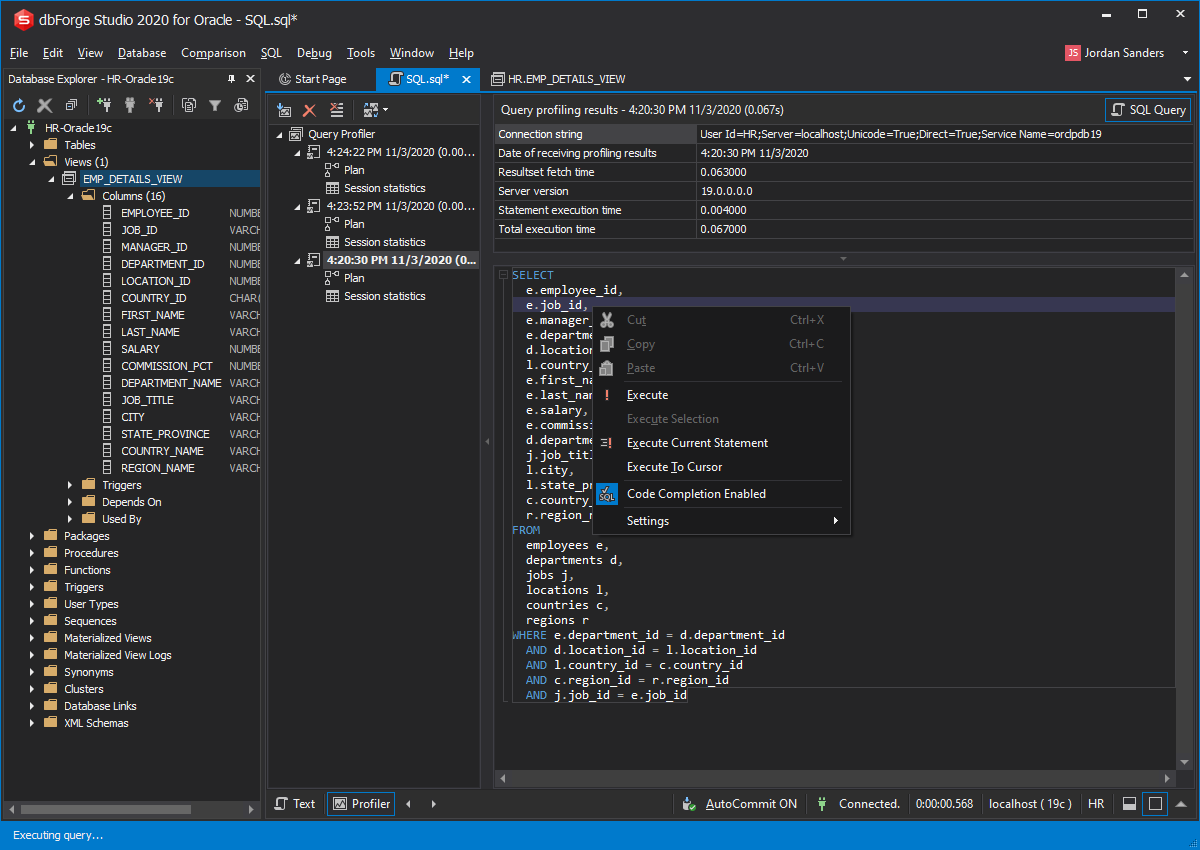
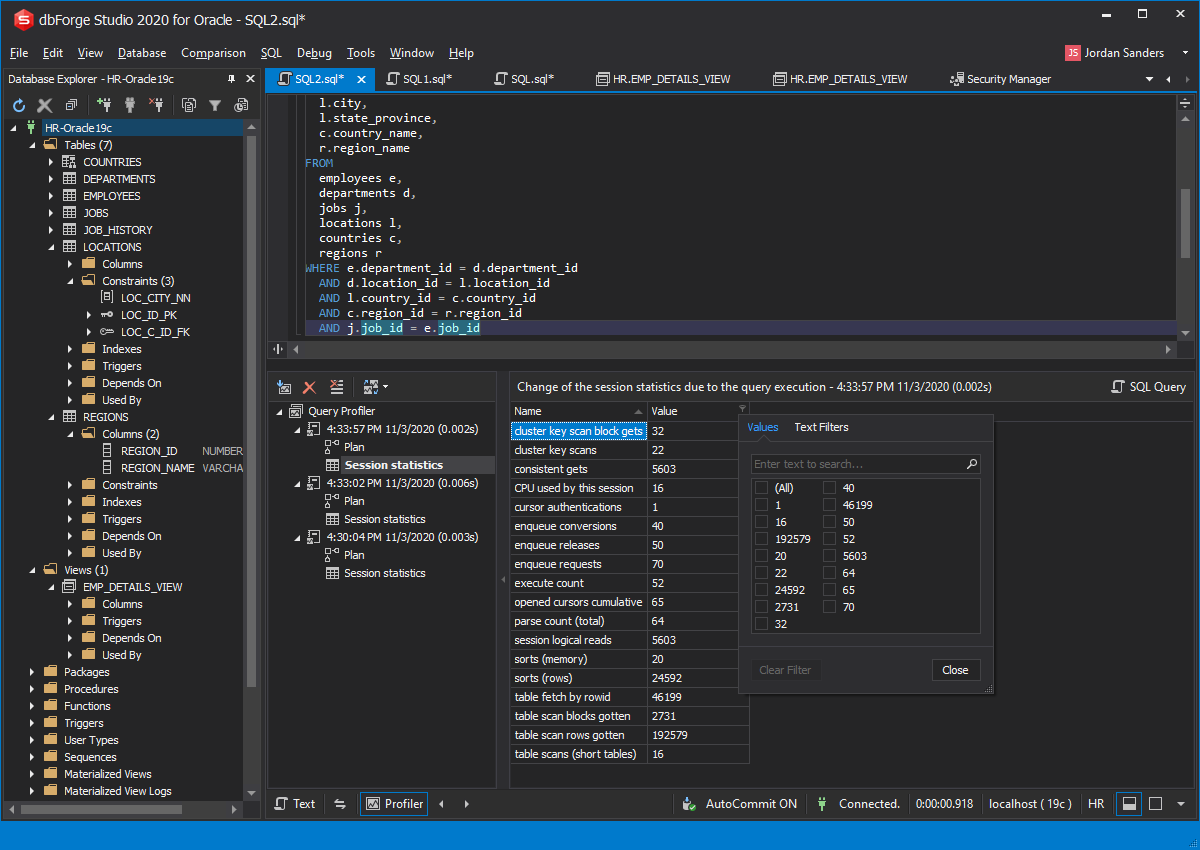
The Query Profiler functionality helps you measure and optimize query performance in Oracle databases by using the EXPLAIN plan, analyzing query profiling results, and collecting session statistics.

Identifying queries that take a much longer time than expected is an important task in optimization of Oracle queries in the most effective way. In dbForge Studio for Oracle, this can be achieved with the help of a query optimization tool - Oracle SQL Profiler. The tool helps you not only analyze when query execution causes delays and impacts performance, but also why it is slow. With the capabilities of the Query Profiler, you can:

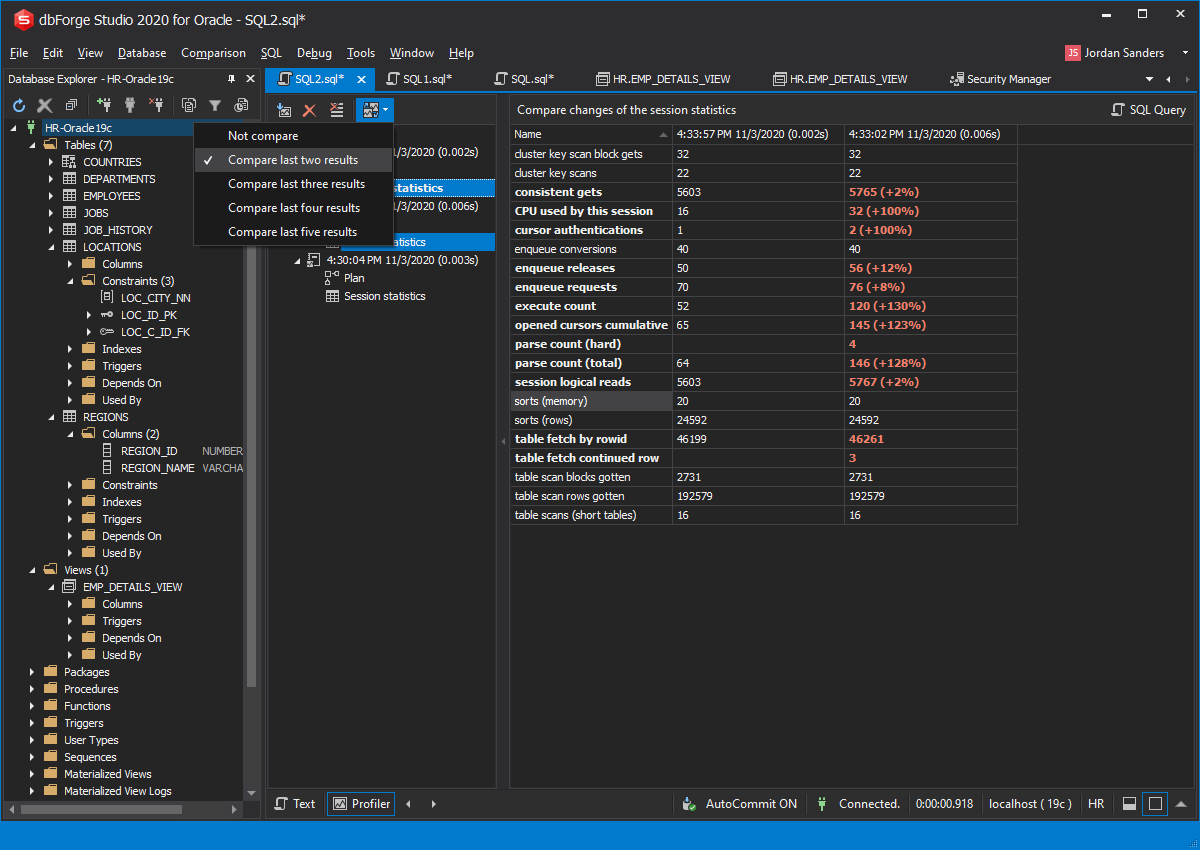
  • Compare query profiling results to determine whether query execution time has been reduced after the change
  • Detect potential bottlenecks that may slow down query performance
  • Analyze the EXPLAIN plan and track session statistics
  • Estimate how much time and resources were spent on query execution
  • Easily investigate the unusual behavior of queries

Profiling without extra actions

To tune and optimize query performance, you don't have to navigate to other tools to collect the required information. Instead, you can get and evaluate all data on the tabs of the Oracle SQL Profiler tree:

  • Query profiling results grid that includes information about server connection, date, fetch time, and execution time of the query
  • EXPLAIN plan that shows the steps Oracle query optimizer chose to execute the SELECT statement
  • Session statistics that display differences before and after execution
Estimate query profiling results in the EXPLAIN plan

Keep text of executed queries at hand

No need to copy query text to a notepad after every change. Oracle SQL Profiler keeps the query text along with its profiling results to let you optimize Oracle queries effectively.

All you need to do is to select a required profiling result and click SQL Query. With the query changes history, you can return to any step of the query optimization, review, execute, or save the query.

Actions of the query optimization you can perform to queries in the SQL document

Get Session Statistics for your query

To diagnose performance issues in the most efficient way, statistics must be available. Oracle query profiler proactively collects session statistics for you. Session statistics display changes due to the query execution on the grid and retrieves data for the current connection.

You can then use this data to find out where your session spent much time, what were the reasons for this performance, and how much resources were used to run the query.

Display Session Statistics of the query execution for the current connection

Compare query profiling results visually

The key point in Oracle queries optimization is to view the differences in profiling results after you change your query. With the Oracle query optimization tool, you can select profiling results for two query executions. After that, a table with the date, time, and values of each query execution will appear highlighting the differences with color.

With Query Profiler, you can quickly and efficiently compare general results of query execution and session statistics for each query execution.

Compare results of query execution in Oracle SQL Profiler

Conclusion

Query Profiler is an Oracle query optimization tool designed to tune query performance and to find the slow queries to make them run faster. The tool can easily implement data profiling using Oracle SQL queries, as well as examine query profiling results to boost query performance and decide whether one or another way can minimize the impact on database performance. Along with Oracle SQL Profiler, you get a lot of powerful and easy-to-use database development and management tools and capabilities in dbForge Studio for Oracle.

dbForge Studio for Oracle

Multifunctional Oracle GUI

Availability in the editions of dbForge Studio for Oracle

Feature

Enterprise
Professional
Standard
Express
Query Profiler
Yes
Yes
Yes
None