Best MySQL Performance Monitoring Tools and Metrics to Monitor
MySQL performance monitoring tools have gone beyond a nice-to-have. They can make the difference between smooth database operations and constant firefighting. A good MySQL performance strategy helps you avoid slow queries, unexpected downtime, and resource bottlenecks that directly affect both user experience and business growth. That's why, whether you're managing a small application or scaling a large platform, having the right MySQL monitoring tools and knowing the metrics to check is essential.
This guide explains everything you need to know to select the best MySQL performance monitoring tools and the database metrics most important for your day-to-day operations. It explores effective strategies such as detecting real-time issues, optimizing long-term database health, analyzing slow queries, identifying resource bottlenecks, and preventing incidents before they affect your apps. By the end, you will have learned how to create a reliable monitoring strategy that keeps your MySQL environment fast, stable, and scalable.
Let's get started.
Why MySQL performance monitoring matters
In database environments, MySQL performance issues rarely happen in isolation. A single bottleneck can trigger multiple problems across the database and application stack, some of which are:
-
High CPU utilization: Can slow dashboards, APIs, and application response times, especially during peak workloads.
-
Memory pressure: May reduce cache efficiency, increase disk reads, and cause query delays or crashes.
-
Blocked transactions and lock contention: Can stall write operations, delay user activity, and create long wait times.
-
Replication lag: May lead to stale reads, delayed reporting, and data inconsistencies between primary and replica servers.
-
Long-running queries: May indicate missing indexes, inefficient joins, or growing workload pressure.
-
Disk I/O bottlenecks: Can make even simple queries feel slow due to delayed reads and writes.
These issues are usually symptoms of deeper inefficiencies, such as poorly optimized queries, schema design problems, or increasing data volume. But with a strong MySQL performance monitoring strategy, you can detect these warning signs early before they escalate into outages or major slowdowns.
Therefore, performance monitoring creates the foundation for long-term database stability. By continuously tracking key metrics and trends, development teams can:
- Identify slow or expensive queries
- Detect abnormal workload changes
- Spot resource bottlenecks early
- Improve troubleshooting speed
- Plan infrastructure capacity more accurately
- Maintain stable performance as systems scale
In addition, consistent MySQL monitoring is essential for maintaining predictable query performance and reducing downtime risk. Without continuous visibility into query behavior, resource usage, and workload patterns, problems can remain hidden until they directly affect users and applications.
Comparison table
The table below evaluates the best MySQL performance monitoring tools based on their features, deployment models, and recommended use cases. It explains how each option supports query analysis, real-time visibility, and alerting—allowing you to select the best fit for your workflow.
| Tool |
Query analysis |
Real-time metrics |
Alerts |
Pricing |
Deployment |
Best fit |
|

dbForge Studio for MySQL
|
Strong |
Good |
Basic |
Trial version / Paid |
Desktop |
DBAs and developers who need MySQL development and performance diagnostics in one tool |
|

MySQL Enterprise Monitor
|
Strong |
Strong |
Strong |
Paid |
Server-based |
Enterprise MySQL monitoring in large environments |
|

Datadog
|
Strong |
Strong |
Strong |
Paid |
SaaS |
DevOps and SRE teams requiring full-stack observability |
|

Prometheus + Grafana
|
Moderate |
Strong |
Strong |
Open-source |
Self-hosted |
Technical teams that want flexibility and open-source monitoring stacks |
|

Sematext
|
Moderate |
Strong |
Strong |
Paid |
SaaS |
Teams that want ready dashboards, metrics, and logs |
|

Zabbix
|
Moderate |
Strong |
Strong |
Open-source |
Self-hosted |
IT teams that require Infrastructure-wide monitoring |
You can use this comparison table as a starting point, then dive deeper into how each tool supports MySQL server monitoring and long-term performance optimization. Let's get into it.
Note
When assessing MySQL monitoring tools, consider how well each tool corresponds to your team's operational requirements and technical expertise.
Best MySQL performance monitoring tools
There are many MySQL performance monitoring tools on the market today. However, not all tools fit every database management workflow. Choosing the best option for your workflow depends on whether you need detailed query analysis, real-time infrastructure visibility, or an all-in-one development and monitoring solution. In this section, we have picked the best tools and analyzed what makes them stand out.
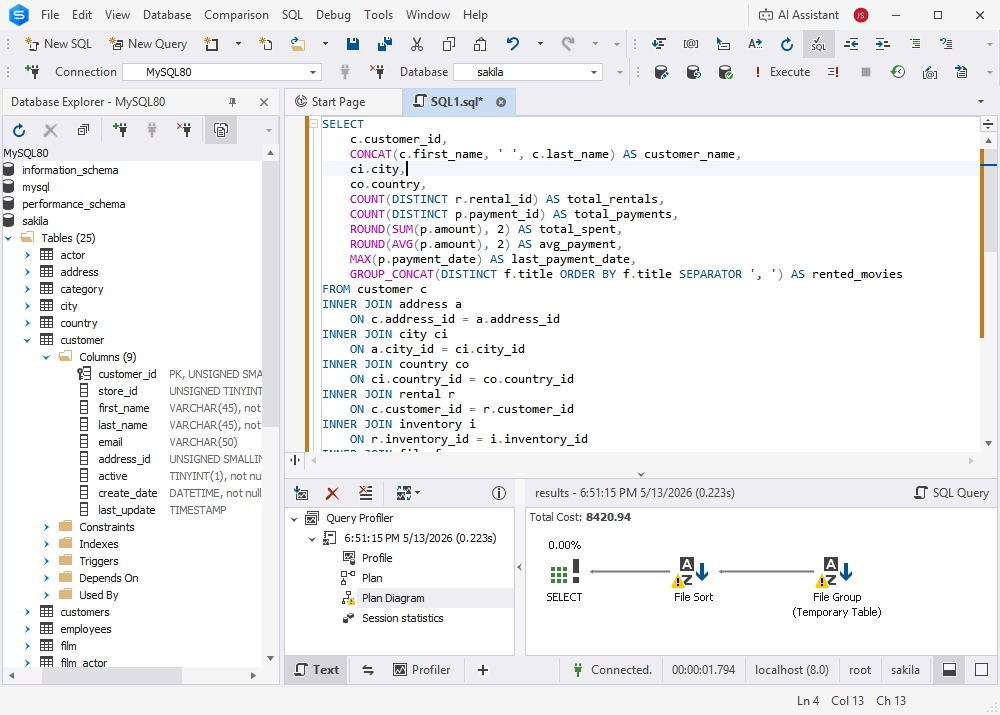
dbForge Studio for MySQL is one of the strongest choices for teams that need development, administration, performance diagnostics, and AI-assisted optimization in a single environment. It combines database management, query building, and integrated AI Assistant, allowing DBAs and developers to move from issue detection to query optimization faster without constantly switching between tools.
Its built-in profiler and query analysis capabilities make it especially useful for finding slow queries and understanding execution behavior. Instead of using other tools, DBAs and developers can analyze execution plans, compare query performance, and modify SQL directly within the IDE.
In addition, the integrated AI Assistant can help generate, explain, and optimize queries, making it easier to troubleshoot performance issues and improve productivity during database development and administration.
Pros
- Built-in query profiler and execution plan analysis
- Reduced context switching between tools
- Strong support for query optimization workflows
- Integrated environment for development and performance tuning
- Integrated AI Assistant for query generation, explanation, and optimization
Cons
- Limited real-time alerting compared to dedicated monitoring tools
- Desktop-based, not ideal for distributed team monitoring
Price
- Free trial (30 days)
- Free Express edition
- Paid (subscription-based or perpetual license)
Features
- Query profiling and performance analysis
- Execution plan visualization
- SQL debugging and optimization tools
- Database management and administration
User reviews
Users appreciate its all-in-one approach, especially for query tuning and database development. It's well praised for improving productivity across multiple servers.
dbForge Studio for MySQL
A powerful, all-in-one IDE for MySQL and MariaDB professionals that helps design, develop, manage, and optimize databases faster and with confidence
MySQL Enterprise Monitor
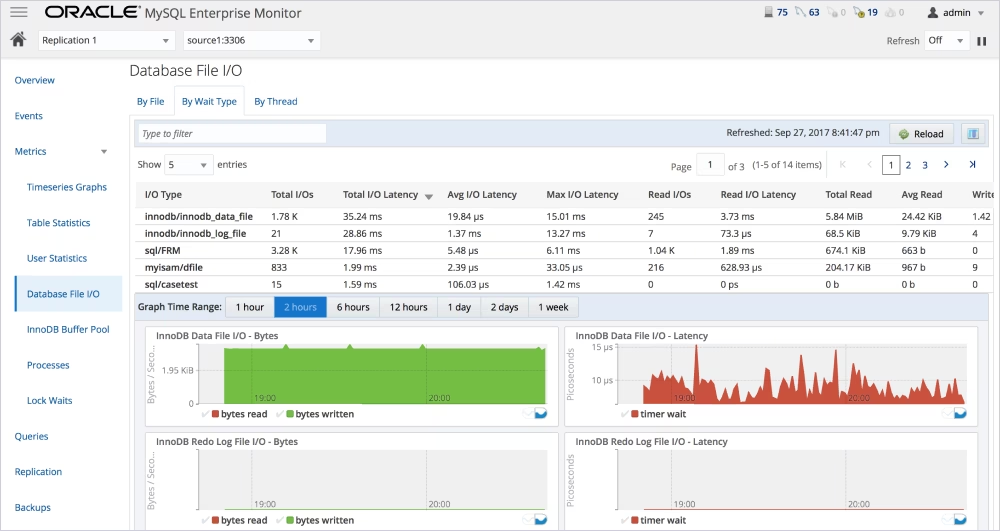
MySQL Enterprise Monitor is Oracle's dedicated solution for enterprise-level MySQL server monitoring. It provides real-time database performance monitoring, along with alerts and recommendations for workload optimization.
The tool relies on the MySQL Performance Schema for detailed insights into query execution and server activities. This makes it especially useful in large environments that require continuous monitoring and proactive issue detection.
Pros
- Deep integration with the MySQL ecosystem
- Strong real-time monitoring and alerting
- Enterprise-level scalability
Cons
- Configuration and tuning required for full value
- Limited flexibility outside MySQL environments
Price
- Paid (part of the MySQL Enterprise subscription)
Features
- Real-time performance monitoring
- Query execution statistics
- Automated alerts and recommendations
- Integration with MySQL Performance Schema
User reviews
Well-regarded in enterprise settings for stability and depth, though some users note complexity during setup and configuration.
Datadog
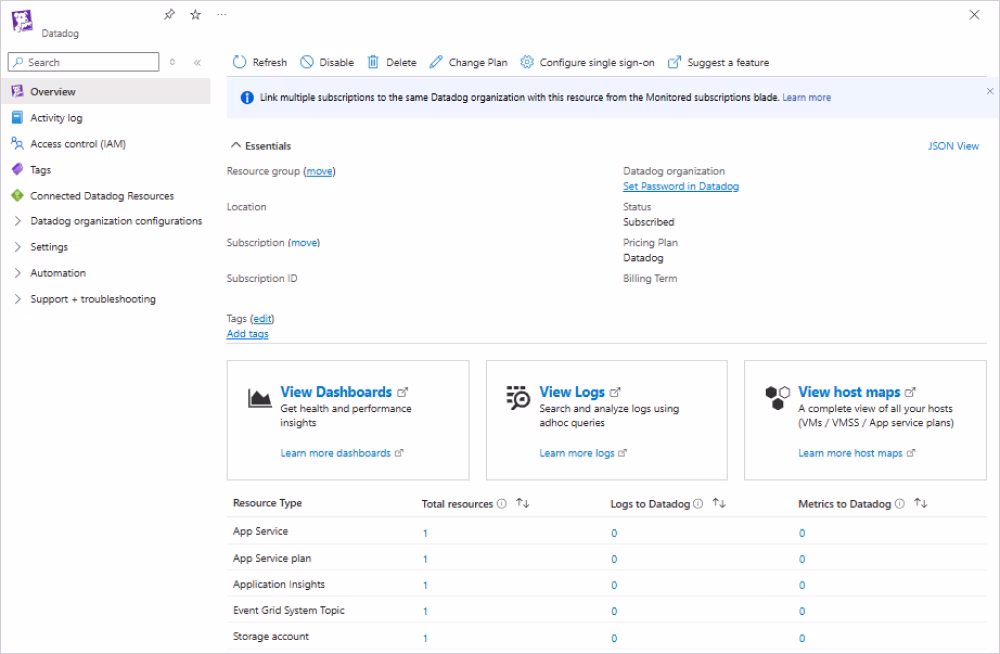
Datadog is a full-stack observability platform with advanced MySQL monitoring and analytics features. It provides real-time dashboards, query-level data, and anomaly-based alerts, making it ideal for modern DevOps and SRE teams.
Its ability to integrate database performance, infrastructure, and application measures gives teams a complete picture of system health. This makes it easier to diagnose issues across different tiers of the stack.
Pros
- Strong real-time monitoring and alerting
- Advanced analytics and anomaly detection
- Unified view across infrastructure and applications
Cons
- Can become expensive at scale
- Requires setup for optimal dashboard customization
Price
- Paid (subscription-based)
Features
- Query-level performance metrics
- Real-time dashboards
- Anomaly detection and alerts
- Integration with cloud and infrastructure services
User reviews
Highly rated for flexibility and visualization capabilities, though pricing is a common concern for larger deployments.
Prometheus + Grafana
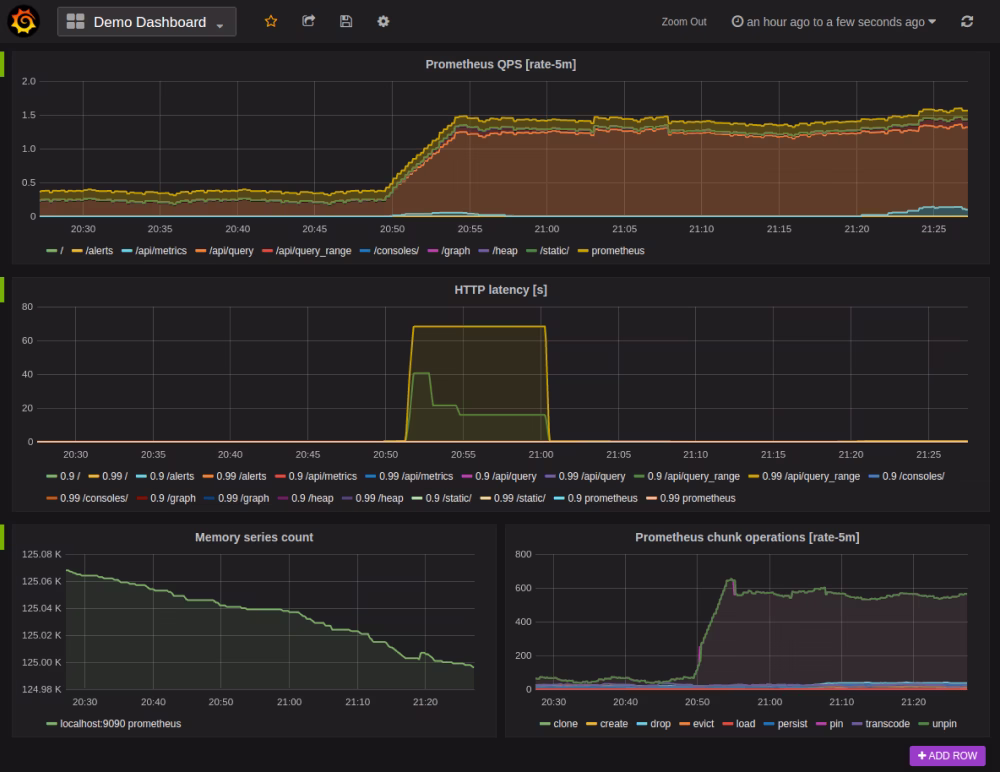
Prometheus and Grafana make up a popular open-source stack for flexible MySQL monitoring. Together, they provide statistics collection and customizable dashboards, becoming an excellent solution for technical teams.
Prometheus collects time-series data from MySQL instances, while Grafana visualizes it via dashboards. This combination enables teams to design highly customized monitoring systems tailored to their requirements.
Pros
- Open-source and highly flexible
- Strong real-time metric collection
- Customizable dashboards
Cons
- Requires setup and maintenance
- Limited out-of-the-box MySQL-specific insights
Price
Features
- Time-series data collection
- Custom dashboard creation
- Alerting based on metrics
- Integration with exporters for MySQL
User reviews
Favored by engineering teams for flexibility and cost-effectiveness, but requires expertise to implement and maintain.
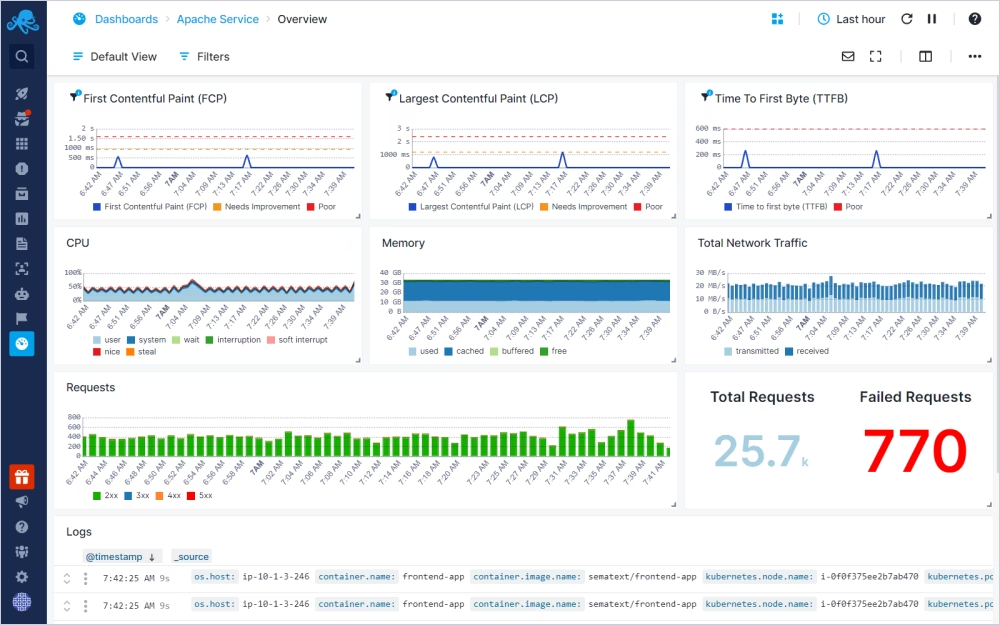
Sematext
Sematext offers a unified monitoring and logging platform that includes robust MySQL performance-tracking capabilities. It provides real-time visibility into critical database metrics and enables analysis through prebuilt dashboards.
Sematext allows organizations to monitor MySQL instances by tracking memory utilization, connections, cache performance, and query activity, all from a single interface.
Pros
- Easy-to-use dashboards
- Metrics and logs combined on one platform
- Quick setup with prebuilt visualizations
Cons
- Less customizable than open-source solutions
- Advanced features may require higher-tier plans
Price
- Paid (subscription-based)
Features
- Real-time performance monitoring
- Prebuilt MySQL dashboards
- Log and metric correlation
- Alerts and anomaly detection
User reviews
Users highlight ease of use and fast setup, though some prefer more customization options.
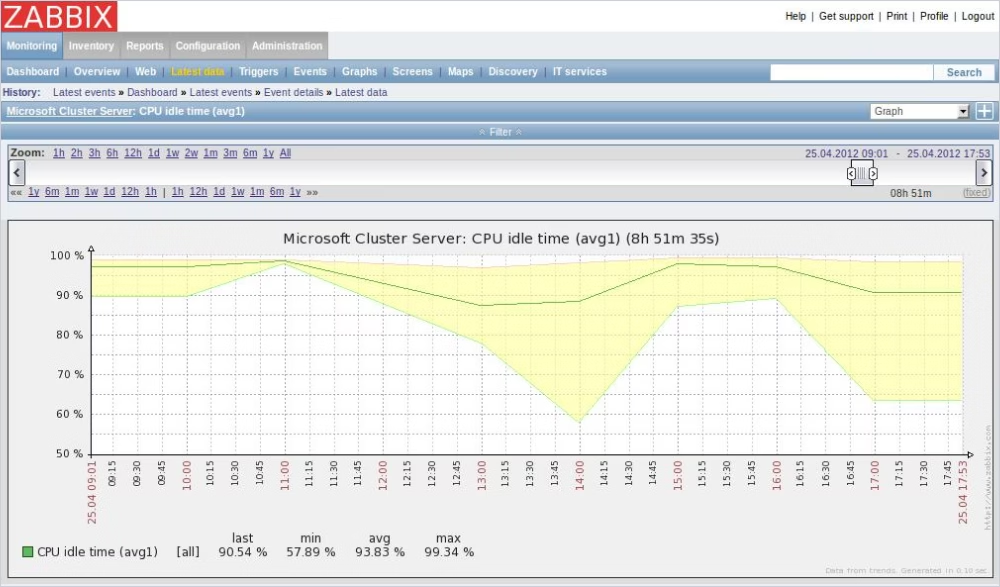
Zabbix
Zabbix is a mature monitoring platform for tracking the performance of MySQL databases, servers, networks, and applications. It's ideal for teams managing diverse infrastructure environments.
Zabbix provides comprehensive monitoring capabilities, enabling teams to track MySQL performance across a larger IT ecosystem. It supports real-time metrics collection, alerts, and configurable dashboards.
Pros
- Open-source and feature-rich
- Full infrastructure monitoring
- Strong alerting capabilities
Cons
- Steeper learning curve
- Requires setup and ongoing maintenance
Price
Features
- Database and infrastructure monitoring
- Real-time metrics and alerts
- Custom dashboards and reporting
- Scalable architecture
User reviews
Widely appreciated for its robustness and flexibility, though initial configuration can be complex for new users.
The most important MySQL metrics to monitor
The most important MySQL metrics are those that directly indicate performance, stability, and scalability under real workloads. Effective MySQL performance monitoring focuses on a core set of signals that help teams identify bottlenecks, understand system behavior, and prevent incidents from escalating. If you want to monitor MySQL performance continuously, these indicators offer the clearest and most useful insights.
Here's a breakdown of the important metrics and what they truly mean in practice.
| Metric |
Why it matters |
What it can reveal |
| Query response time |
Shows how quickly MySQL responds to requests and provides one of the clearest signs of overall database health. |
Rising latency often points to poor indexing, inefficient SQL queries, blocking, or increased workload pressure. |
| Slow queries and query execution time |
Helps identify statements that consume the most time and create the biggest tuning opportunities. |
Expensive joins, full table scans, missing indexes, unstable query patterns, and statements that need optimization. |
| CPU usage |
Indicates how hard the server is working to process the current workload. |
High CPU can signal costly queries, too much concurrency, poor indexing, or uneven workload distribution. |
| Memory usage and buffer pool health |
Shows whether MySQL has enough memory to keep active data in cache and reduce unnecessary disk access. |
Memory pressure, low cache efficiency, slower reads, and unstable performance under load. |
| Disk I/O and storage latency |
Reveals whether storage performance is limiting database operations. |
Slow reads, delayed writes, checkpoint pressure, and infrastructure bottlenecks that appear to be database issues. |
| Connections, threads, and concurrency |
Shows how many sessions are hitting the server and how well MySQL handles simultaneous work. |
Connection spikes, thread buildup, lock contention, queueing, and server saturation during peak activity. |
| Transaction throughput |
Measures how much useful work the database is completing over time. |
Capacity limits, workload changes, and whether the server is keeping up with growing demand. |
| Locks, waits, and deadlocks |
Exposes contention problems that can slow down write-heavy or high-concurrency systems. |
Blocking transactions, long waits, failed operations, and poor query or transaction design. |
| Replication lag |
Critical for setups that rely on replicas for reads, reporting, or failover. |
Stale reads, delayed reporting, weaker failover readiness, and scaling limits in replica-based environments. |
| Error rate and availability signals |
Helps teams catch instability that uptime alone cannot reveal. |
Failed connections, aborted queries, restart events, and patterns that may lead to incidents or outages. |
Together, these indicators provide a comprehensive picture of database health. For example, a surge in query response time, paired with high CPU and increasing lock waits, clearly indicates congestion or inefficient queries, rather than a general slowness. This is why structured MySQL monitoring always links metrics to their underlying causes, enabling faster troubleshooting and more informed optimization decisions.
Where to get MySQL performance data
MySQL performance data comes from a few core internal and system-level sources that together provide a complete view of database behavior. Effective MySQL monitoring depends on collecting and combining data from MySQL's built-in instrumentation layers and the underlying operating system. This is what enables accurate MySQL performance monitoring and reliable troubleshooting.
Instead of relying on a single source, teams typically correlate multiple data streams to understand what is really happening during performance issues. These sources include MySQL's internal schemas, logging systems, and external OS metrics that reflect infrastructure pressure. Let's break them down.
MySQL Performance Schema
The MySQL Performance Schema is the primary internal engine for collecting detailed performance data. It tracks low-level execution details about queries, locks, waits, and resource usage without requiring manual logging.
One of the most useful components of the MySQL Performance Schema is the events_statements_summary_by_digest table, which aggregates query performance data and helps identify expensive or frequently executed statements. This makes it easier to spot patterns, such as slow queries or inefficient execution paths.
This Performance Schema is essential for deep MySQL server monitoring because it captures real execution behavior rather than just logs or estimates.
sys schema
The sys schema is a higher-level view built on top of the Performance Schema that simplifies analysis. It transforms raw performance data into readable views, making it easier to interpret system behavior without writing complex queries.
Also, the sys schema provides ready-made insights into slow queries, resource usage, and wait events, helping you quickly understand performance bottlenecks. This layer is especially useful for DBAs who want quick diagnostics without digging into raw Performance Schema tables.
Slow query log
The slow query log is one of the most practical tools for identifying inefficient SQL statements. It records queries that exceed a defined execution-time threshold, making it a direct way to identify performance bottlenecks.
This log is especially valuable during MySQL monitoring because it highlights real-world user impact. By analyzing slow queries over time, teams can identify missing indexes, inefficient joins, or queries that degrade as data grows.
Operating system metrics
Operating system metrics provide the external context needed to understand MySQL performance fully. CPU usage, memory consumption, disk I/O, and network activity help explain whether performance issues originate from the database or the underlying infrastructure.
For example, high disk latency may indicate storage bottlenecks, while CPU saturation may indicate heavy query workloads. Without OS-level data, it's difficult to separate database issues from system limitations during MySQL performance monitoring.
In practice, combining these four sources provides a complete, layered view of database health. This multi-source approach is the foundation of reliable MySQL monitoring tools and effective long-term performance optimization.
How to choose the right MySQL monitoring tool
When choosing the best MySQL monitoring tool for your workflow, keep in mind that the most feature-rich tools aren't always the best. Instead, go for tools that align with how your systems are deployed, how your team works, and how deeply you need to monitor MySQL performance in daily operations.
As such, you want to evaluate factors like ease of setup, alerting capabilities, dashboard quality, scalability, and integration options. A structured decision process helps avoid overengineering or under-monitoring your database stack. Below is a breakdown of how to choose the right MySQL monitoring tool for your needs.
Choose based on your environment
Your infrastructure setup is the first factor that determines the right monitoring approach. Different environments require different MySQL server monitoring strategies.
- Cloud environments benefit from SaaS-based tools with quick integration and auto-scaling dashboards.
- On-premise systems often require self-hosted solutions for security and control.
- Hybrid setups need tools that can unify metrics across environments.
- Managed MySQL services may limit low-level access, shifting focus to external metrics.
- Kubernetes deployments require monitoring tools that support dynamic scaling and container-level visibility.
The key is ensuring your MySQL performance monitoring tools match where and how MySQL actually runs.
Decide how much query visibility you need
Not all teams need the same level of query insight. The depth of visibility determines which tool is appropriate for you.
- Basic monitoring focuses on host-level metrics like CPU, memory, and connections.
- Statement-level analysis helps identify slow queries and inefficient execution patterns.
- Full query tracing provides end-to-end visibility into query execution paths.
If your main goal is infrastructure health, lightweight monitoring may be enough. But for performance tuning and optimization, deeper query-level visibility is essential for effective MySQL monitoring.
Check dashboards and alerting depth
Dashboards and alerts determine how actionable your monitoring system really is. Raw metrics alone are not enough for fast decision-making.
Good MySQL performance monitoring tools should provide:
- Clear dashboards that highlight trends, not just numbers
- Alerts triggered by meaningful thresholds or anomalies
- Correlation between metrics (e.g., CPU spikes linked to slow queries)
Without this, teams often detect issues too late or struggle to understand root causes during incidents.
Consider open-source vs commercial trade-offs
Open-source and commercial tools each offer distinct advantages depending on your needs.
- Open-source tools like Prometheus or Zabbix offer flexibility, customization, and lower cost but require more setup and maintenance.
- Commercial tools like dbForge Studio for MySQL provide faster deployment, polished dashboards, support, and advanced analytics but come with licensing costs.
Your decision should depend on whether you prioritize control and customization or speed and ease of use in MySQL monitoring tools.
Match the tool to the user
The right tool also depends on who will use it daily. Different roles require different levels of complexity and focus.
- DBAs need deep query analysis, indexing insights, and performance tuning capabilities.
- Developers benefit from tools that integrate with query editing and debugging workflows.
- DevOps engineers prioritize infrastructure-wide visibility and alerting.
- Architects focus on scalability trends and long-term performance planning.
Aligning the tool with the user ensures that MySQL performance monitoring becomes part of the daily workflow.
Conclusion
When choosing the best MySQL performance monitoring tool, the right one depends on what you need most: flexibility, observability, or built-in diagnostics and tuning capabilities. Some teams prefer open-source stacks for full control, others rely on enterprise observability platforms for end-to-end visibility, while many benefit from integrated tools that combine MySQL performance monitoring with query analysis and optimization in a single environment.
However, the goal of MySQL monitoring remains the same—understanding how your database behaves under real workload conditions and responding before issues impact users. Whether you're using lightweight open-source setups or full-scale commercial platforms, the effectiveness of your strategy depends less on the number of dashboards than on the quality of the insights they provide.
Good monitoring is not about collecting every possible metric. It's about focusing on the signals that matter: slow queries, resource saturation, contention, and capacity trends. Consistently monitoring MySQL performance in these areas enables you to detect problems early, reduce downtime, and scale your systems with confidence.
dbForge Studio for MySQL
A powerful, all-in-one IDE for MySQL and MariaDB professionals that helps design, develop, manage, and optimize databases faster and with confidence
FAQ
What is the best MySQL performance monitoring tool?
The best MySQL performance monitoring tool is not a one-size-fits-all solution. If you require full-stack observability, Datadog is an excellent choice; Prometheus + Grafana is suitable for flexible, open-source configurations. Tools like dbForge Studio for MySQL or MySQL Enterprise Monitor provide greater MySQL-specific insights to teams focused solely on database diagnostics and tuning. The best option should correspond to your MySQL monitoring requirements, team skills, and infrastructure complexity.
What metrics should I monitor in MySQL first?
Start with data that directly demonstrates performance and user impact. The most essential ones are query response time, slow queries, CPU utilization, memory (buffer pool) health, disk I/O, and locks or wait events. These metrics quickly reveal whether you should be monitoring MySQL performance for indexing issues, resource bottlenecks, or workload spikes. Once these are stable, you can consider replication lag, concurrency, and transaction throughput.
How can I monitor MySQL query performance?
You can monitor MySQL query performance using the slow query log, Performance Schema, and sys schema views. The slow query log highlights queries that exceed execution thresholds, while the Performance Schema provides detailed execution statistics. The sys schema simplifies this data into readable formats for faster analysis. Together, these sources help identify inefficient queries, missing indexes, and execution bottlenecks in effective MySQL performance monitoring.
What is the difference between MySQL monitoring and MySQL tuning?
MySQL monitoring is about visibility, while MySQL tuning is about optimization. Monitoring focuses on collecting and analyzing metrics to understand system health, performance trends, and potential issues. Tuning, on the other hand, involves actively improving performance by optimizing queries, indexes, schema design, or server configuration. In practice, MySQL monitoring tools help detect problems, while tuning resolves them.

