Entity Framework Profiler in LINQ Insight!
Applications, using Entity Framework usually work with data in the following way. First they create context objects. Then they query data via LINQ to Entities statements, which are compiled and generate SQL statements that actually query data from the database. The retrieved data is materialized as entity objects (or anonymous class instances), and the applications works with these objects instead of querying relational data directly. Then the applications can access to related entities via the reference and collection properties, and this in turn produces additional SQL queries to get the necessary data. After the applications finish working with entities, if there were any changes to the queried entities, applications save them to database via SaveChanges calls. SaveChanges generates and sends the necessary INSERT, UPDATE, and DELETE commands to the database. After the work with entities is finished, the context is disposed.
Though all these actions are performed by Entity Framework run-time, and are transparent for the application that works with entities, they may be complex and affect application performance greatly. That's why you probably need a good Entity Framework profiler to create efficient applications using Entity Framework for data access. Entity Framework profiler in LINQ Insight really profiles ORM events and allows you to see how much time LINQ statement or SaveChanges call takes to execute as a whole even if it generated multiple SQL statements.
Example Application
Let's show how to profile Entity Framework applications on a simple example. We have used the widely used NorthwindEF sample database for our example, and generated the model for it with EDM wizard using default settings. The application is a simple console application with the following code:
using System.Collections.Generic;
using System.Linq;
using EFSample.Model;
using System;
using System.Threading.Tasks;

namespace EFSample {

  class Program {

	static void Main(string[] args) {


	  LoadUKCustomers();
	  LoadUKCustomersWithOrders();
	  LoadOrders();
	  LoadFirstDiscontinuedProduct();
	  AddNewProductAndCategory();

	  AntiPattern1();
	  AntiPattern2();
	  AntiPattern3();

	}

	static void AntiPattern1()
	{

		using (NorthwindEFEntities db = new NorthwindEFEntities())
		{

			var query = from c in db.Customers
						select c;

			foreach (var customer in query)
				customer.Orders.ToList();
		}
	}

	static void AntiPattern2()
	{

		NorthwindEFEntities db = new NorthwindEFEntities();

			var query = from c in db.Customers
						select c;
			query.ToList();
	}

	static void AntiPattern3()
	{

		using (NorthwindEFEntities db = new NorthwindEFEntities())
		{
			Task.Factory.StartNew(() =>
			{

				var query = from c in db.Customers
							select c;
				query.ToList();
			}).Wait();
		}
	}

	// Simple query
	static IEnumerable<Customer> LoadUKCustomers() {

	  using (NorthwindEFEntities db = new NorthwindEFEntities()) {

		var query = from c in db.Customers
					where c.Country == "UK"
					orderby c.ContactName
					select c;

		return query.ToList();
	  }
	}

	// Query with include
	static IEnumerable<Customer> LoadUKCustomersWithOrders() {

	  using (NorthwindEFEntities db = new NorthwindEFEntities()) {

		var query = from c in db.Customers.Include("Orders")
					where c.Country == "UK"
					orderby c.ContactName
					select c;

		return query.ToList();
	  }
	}

	// Query with parameters
	static IEnumerable<Order> LoadOrders() {

	  string country = "Austria";
	  string city = "Graz";

	  using (NorthwindEFEntities db = new NorthwindEFEntities()) {

		var query = from o in db.Orders
					where o.ShipCountry == country
					where o.ShipCity == city
					select o;

		return query.ToList();
	  }
	}

	// Deferred loading
	static void LoadFirstDiscontinuedProduct() {

	  using (NorthwindEFEntities db = new NorthwindEFEntities()) {

		var query = from p in db.Products
					where p.Discontinued
					orderby p.ProductName
					select p;

		var product = query.First();
		var catedory = product.Category;
		var orderDetials = product.Order_Details.ToList();
	  }
	}

	// SaveChanges
	static void AddNewProductAndCategory() {

	  using (NorthwindEFEntities db = new NorthwindEFEntities()) {

		// Add category
		Category category = Category.CreateCategory(200, "Category #1");
		for (int i = 0; i < 2; i++) {
		  Product product = Product.CreateProduct(300 + i, "Product #" + i, false);
		  category.Products.Add(product);
		}
		db.Categories.AddObject(category);
		db.SaveChanges();

		// Delete category.
		db.Categories.DeleteObject(category);
		db.SaveChanges();
	  }
	}
  }
}
This application executes several methods, and each of them creates a context, uses it to execute some LINQ query, and disposes it. These methods demonstrate various situations you can analyze in the profiler.
To start profiling our Entity Framework example, open the LINQ Profiler window (select Other Windows -> LINQ Profiler from the View menu), click the Start profiler session button on the LINQ Profiler window toolbar, and start the application (press F5).
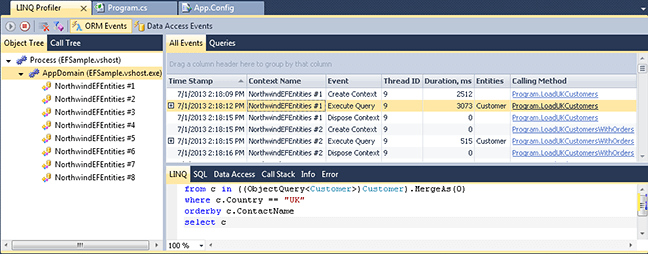
Simple Query
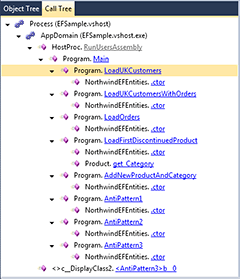
First our Entity Framework application executes the LoadUKCustomers method, which contains a simple query, selecting customers from the United Kingdom. Our profiler displays the following events for this method: context creation, query execution, and context disposing. You may filter out other events, that are not related to this method, using the Call Tree window. Just switch to the Call Tree and select the Program.LoadUKCustomers method.
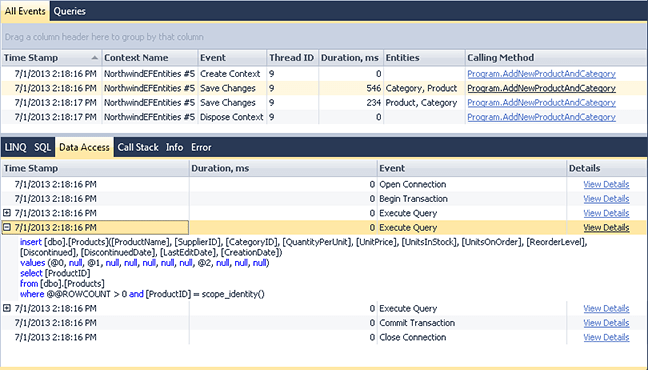
Our profiler displays the duration of these events, and you can see some additional information on the LINQ query by selecting it in the events grid and switching the tabs below the grid. Here you can find the text of the LINQ query, generated SQL, related data access events, etc.
Switch to the Data Access tab below the event grid to display the related data access
events. Note that the duration of LINQ query execution event is greater than the
sum of durations of all the corresponding data access events. Unlike other Entity
Framework profilers, our profiler displays the real ORM call performance information,
not just database call information.
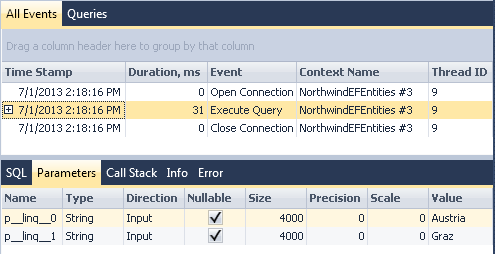
Query with Parameters
The LoadOrders method executes a query that uses parameters. Select this method in the Call Tree window to see the query it executes. On the SQL tab you can see some information about the query parameters. Switch to the Data Access tab and click the View Details link in the Execute Query row. This allows you to quickly navigate to the corresponding data access event in the Data Access Events view. Here, on the Parameters tab, you can see more detailed information about SQL parameters in the generated query.
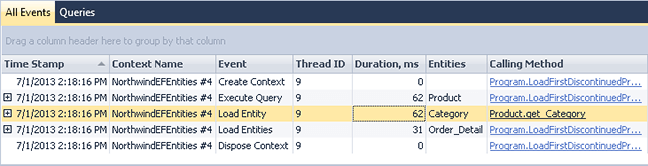
Loading Related Entities
Other Entity Framework profilers actually display information on data access events, not ORM calls, and it's impossible to distinguish loading related entities from a LINQ queries selecting a record by a key value, because they generate identical SQL queries.
LINQ Insight offers true ORM profiling, it displays information for the actual ORM calls, and shows the actual executed LINQ statements. LINQ Insight's profiler tool displays loading related entities as a separate kind of events. You can see it on our example in the LoadFirstDiscontinuedProduct method.
Select this method in the Call Tree window and look at the ORM events displayed (switch to the ORM Events view if you are still on the Data Access Events view). First, the Product entity is queried in this method. Then its related Category is loaded, and then its collection of OrderDetails entities is loaded. You can see the corresponding Load Entity and Load Entities events after the query execution event. The names of the loaded entities are also displayed.
SaveChanges
Let's look at how our profiler displays the SaveChanges calls. They are demonstrated in the AddNewProductAndCategory method.
Select this method in the Call Tree window. Select a Save Changes event from the list. Note that you can see the affected entities in the grid and all the corresponding data access events (connection, transaction, DML calls).
Data Access Antipatterns
Our sample application also demonstrates some well-known Entity Framework data access antipatterns that may decrease performance greatly and must be avoided. We will discuss here how you can use our profiler to detect these Entity Framework antipatterns.
Select N+1 Antipattern
The first of the demonstrated antipatterns is a well-known N+1 antipattern. It can happen when we select a parent entity and then access its children in a loop. By default, lazy loading is used when accessing the child entities in Entity Framework. In such a case, when a separate SELECT statement is generated and executed each time when a new child entity is accessed, which is rather ineffective.
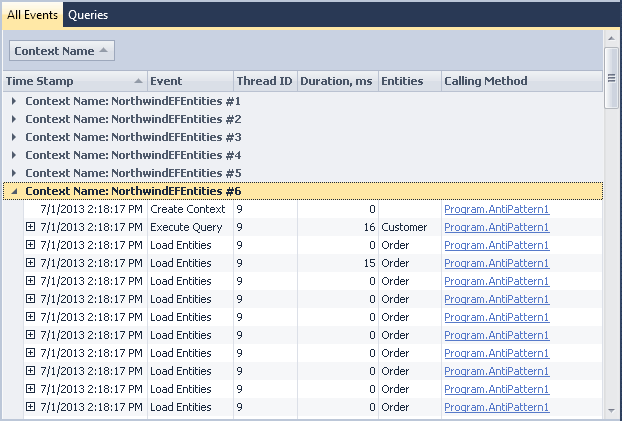
Our sample application demonstrates this antipattern in the AntiPattern1 method. You may select this method in the Call Tree window and look at the ORM calls, however in case of a real project you don't know where such situation can happen. To find such situations in your project use the following method: group the profiling information by context (drag the Context Name column header to the area above the column headers), and expand the contexts. If you see an Execute Query event followed by a large number of the Load Entities event, then it is probably a sign of the Select N+1 antipattern.
To avoid the Select N+1 antipattern, you can, for example, use the Include method in your Entity Framework queries to load these child entities eagerly. An example of using the Include method is demonstrated in the LoadUKCustomersWithOrders method.
Non-disposed Context
Context object is supposed to be used as a unit of work in Entity Framework. It's assumed that it is disposed as soon as some operations with it are finished, and a new context is created for each new unit of work. If a context lives too long, it may cause a decrease of the performance.
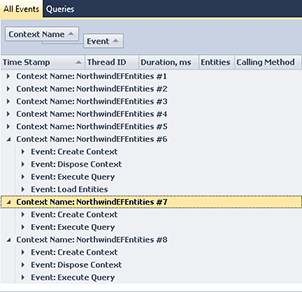
Our profiler helps you to determine situations when a context is not disposed after work with it. To find such situations, group profiler data by contexts as in the previous example, and then group data by the Event column. When expanding contexts, you easily can see contexts that were not disposed (with no Dispose Context event). Our sample demonstrates such situation in the AntiPattern2 method.
Creating and Using Context from Different Threads
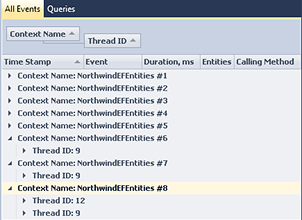
Creating an Entity Framework context from one thread and using it from another thread is considered a very bad practice that may cause errors in run-time. Our sample demonstrates such situation in the AntiPattern3 method. To detect such situation, group the profiler information by the context name and then by thread id. When expanding contexts, you can see which context has ORM events occurred in different threads.