

dbForge Studio for PostgreSQL
AI-powered IDE for database development, management, and data analysis across PostgreSQL and related cloud services
Data analysis and reporting are among the most important database tasks and a constant focus for database administrators and data analysts. When the goal is to uncover trends, patterns, anomalies, and other valuable insights hidden within data, these specialists require tools for data exploration, interpretation, and visualization—ideally with a graphical user interface (GUI) to avoid writing complex SQL queries and achieve faster and more accurate results.
One of the most widely used tools for data analysis is a pivot table that transforms raw data into a summarized, cross-tabular view. While they do not modify the underlying data, they restructure it to present information from different viewpoints. As a dedicated GUI feature, it can become an indispensable part of the data analysis workflow.
This article explores pivot tables as a method for analyzing PostgreSQL data and demonstrates how to use Pivot Tables in dbForge Studio for PostgreSQL.
Pivot tables reorganize row-based data into a summarized cross-tabulation format, thus transforming values that appear as rows into columns. This option makes it easier to compare and analyze data across two dimensions simultaneously.
For example, let's take data like this.
| Region | Quarter | Sales |
|---|---|---|
| East | Q1 | 120 |
| East | Q2 | 150 |
| West | Q1 | 90 |
| West | Q2 | 110 |
It can be transformed into a pivot-style result.
| Region | Q1 | Q2 |
|---|---|---|
| East | 120 | 150 |
| West | 90 | 110 |
This cross-tab layout makes it easier to compare values across categories.
Unlike Excel or SQL Server, PostgreSQL does not have a built-in PIVOT operator. Users typically create pivot-style results using one of these approaches:
The table below explains the differences between these options.
| Method | Best for | Limitations |
|---|---|---|
| crosstab() | SQL-based pivot tables with known columns | Requires tablefunc, defined output columns, correct ordering |
| Conditional aggregation | Pivot without extensions | Best for static known categories |
| Dynamic SQL | Dynamic columns | More complex to maintain |
| dbForge Studio Pivot Table | Visual analysis, filtering, charts, quick reporting | Requires dbForge Studio |
crosstab() is part of the optional tablefunc module. To start using this function, you need to install the tablefunc module for the required database first. In PostgreSQL 9.1 and later, you can do it by running a simple command.
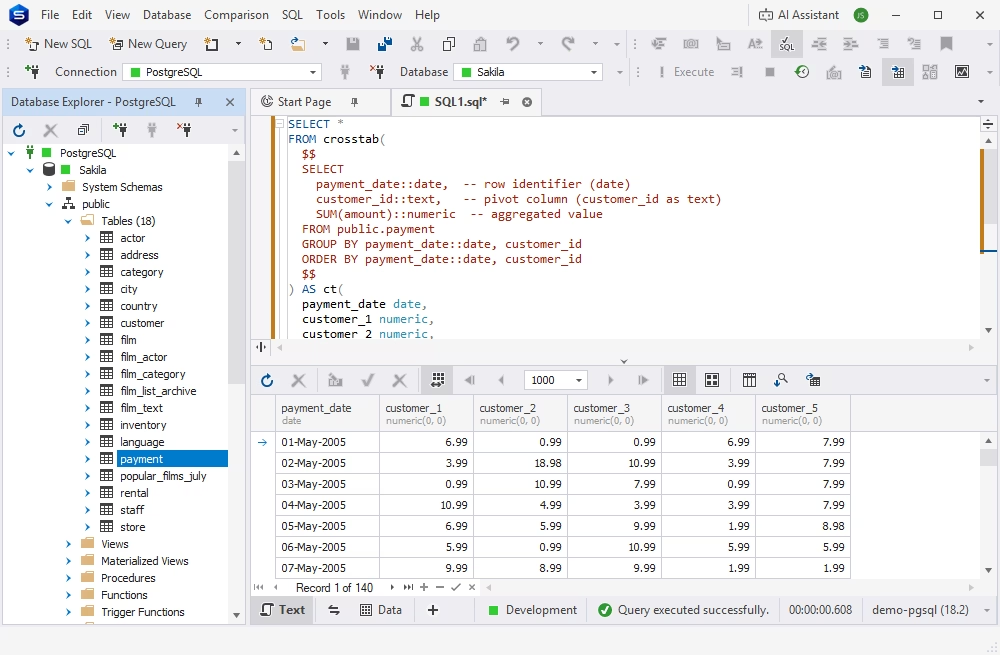
After installing the module, you can use crosstab to get a pivoted result set. In the case below, we are working with the sakila database. The goal is to reorganize the data from the payment table to view payments by date.
SELECT *
FROM crosstab(
  $$
  SELECT
    payment_date::date,  -- row identifier (date)
    customer_id::text,   -- pivot column (customer_id as text)
    SUM(amount)::numeric  -- aggregated value
  FROM public.payment
  GROUP BY payment_date::date, customer_id
  ORDER BY payment_date::date, customer_id
  $$
) AS ct(
  payment_date date,
  customer_1 numeric,
  customer_2 numeric,
  customer_3 numeric,
  customer_4 numeric,
  customer_5 numeric
);
In PostgreSQL, rows can be pivoted to columns without using crosstab(). This approach is called conditional aggregation, a portable SQL option that doesn't require the tablefunc extension.
Conditional aggregation works in the following way:
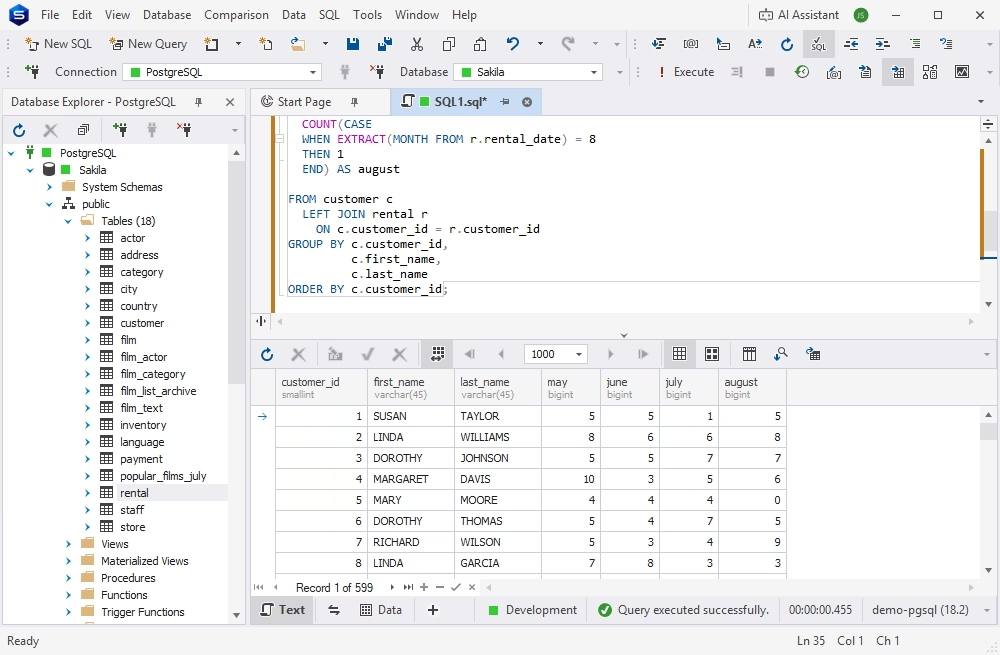
Assume we need to know how many rentals each customer made per month. The necessary data is in the rental table, and we apply conditional aggregation to create a pivoted table.
SELECT
  c.customer_id,
  c.first_name,
  c.last_name,

  COUNT(CASE
  WHEN EXTRACT(MONTH FROM r.rental_date) = 5
  THEN 1
  END) AS may,

  COUNT(CASE
  WHEN EXTRACT(MONTH FROM r.rental_date) = 6
  THEN 1
  END) AS june,

  COUNT(CASE
  WHEN EXTRACT(MONTH FROM r.rental_date) = 7
  THEN 1
  END) AS july,

  COUNT(CASE
  WHEN EXTRACT(MONTH FROM r.rental_date) = 8
  THEN 1
  END) AS august

FROM customer c
  LEFT JOIN rental r
    ON c.customer_id = r.customer_id
GROUP BY c.customer_id,
         c.first_name,
         c.last_name
ORDER BY c.customer_id;
A static pivot works well when you know the values that will become columns. It is simple, efficient, and easy to read, a preferred solution for such scenarios as months or quarters in a reporting period, ratings, categories, etc.
However, there are scenarios where values that become columns are not known ahead of time or may change. For example, when new products or categories are added, or when survey options change, and so on. PostgreSQL cannot automatically create new columns as new categories appear.
As a result, you need to query the database to discover the distinct category values and then write a SQL statement with those values as columns, building the query as a string at runtime. This approach suggests an extra step, which takes time and resources; it also requires knowledge of PL/pgSQL to construct a string for each new column.
On the other hand, there is an alternative: working with changing datasets visually using the built-in Pivot Tables tool in dbForge Studio for PostgreSQL.
dbForge Studio for PostgreSQL is an AI-powered, robust IDE for PostgreSQL, Amazon Redshift, and related databases and cloud platforms. It provides a full set of tools to perform all standard database development, management, and data analysis tasks. Visual pivot tables are just one of many useful tools provided by this solution.
To create a pivot table, launch dbForge Studio for PostgreSQL and execute a query to select the data you want to analyze. Right-click the data grid of the query output and select Send > Pivot Table.
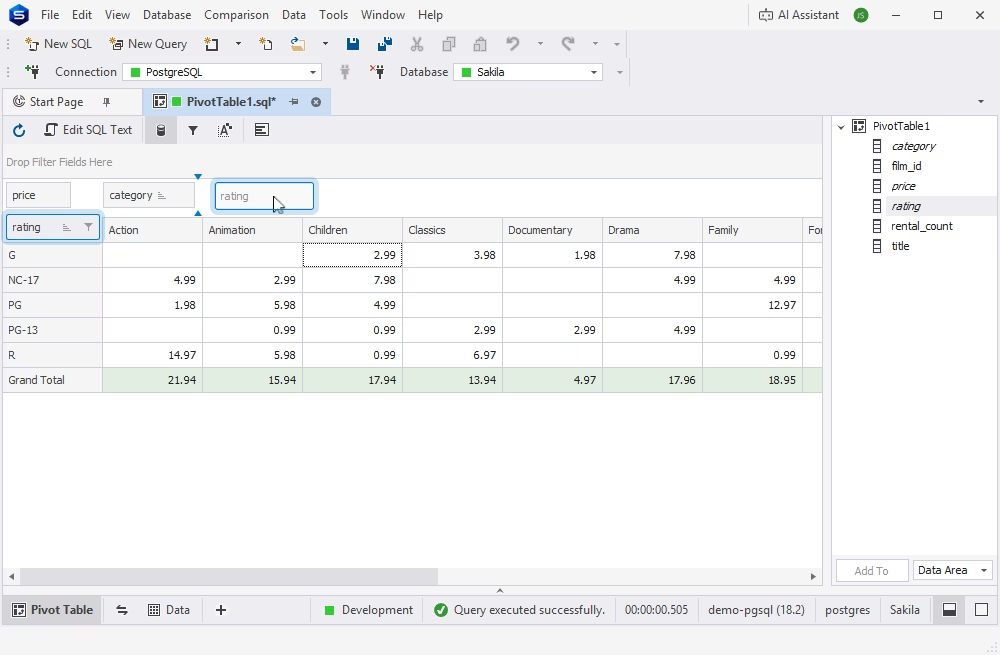
To add fields to the pivot table, simply drag them from the Data Source to the required pivot table area.
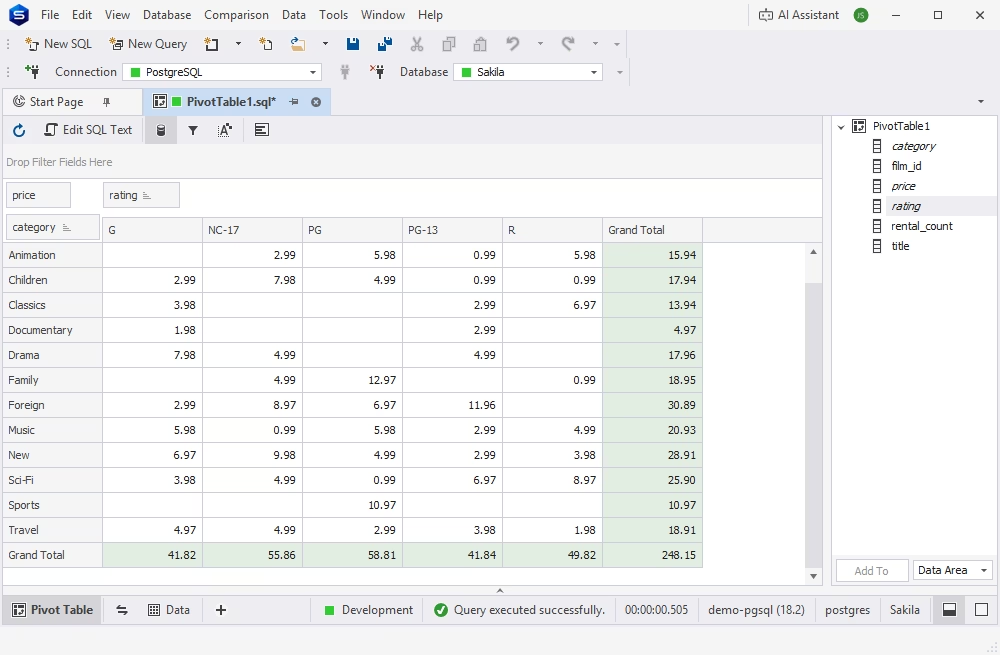
As a result, we get a pivot table very similar to the table created with the help of the crosstab() function. Note that dbForge Studio for PostgreSQL automatically generates the Grand Total columns. By default, the Grand Total cells contain the sum of the values of the rows (columns).
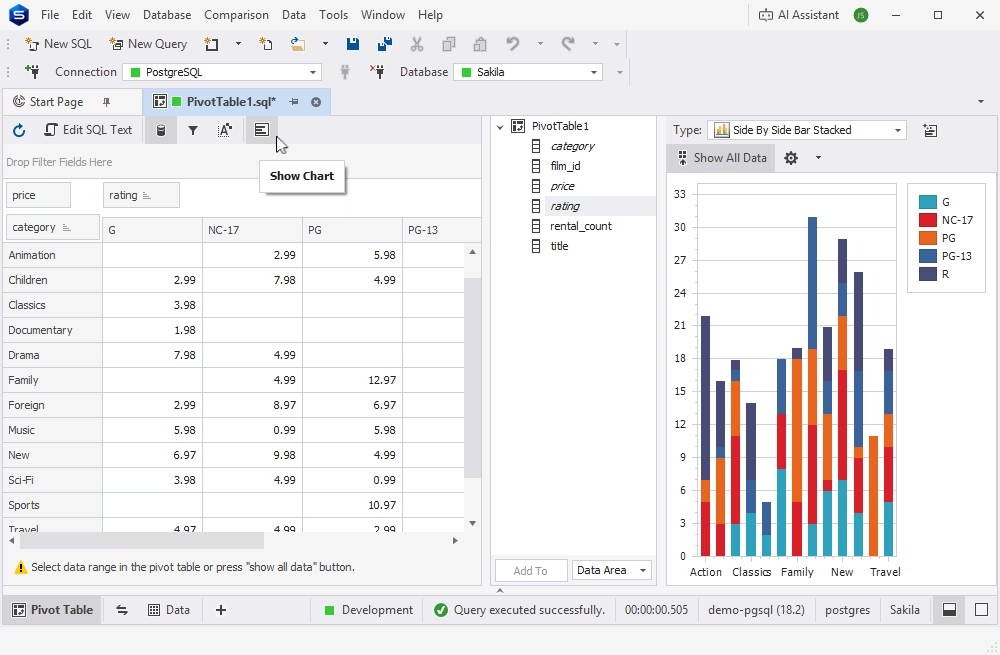
You can also visualize data dependencies and compare them using charts associated with the pivot data: click Show Chart on the pivot table document toolbar and select the chart type.
Changing the layout of a pivot table is key to making data easier to read and scan for details. Simply drag a field from one area of a pivot table to another to redesign its layout and organize data differently.
To push the functionality further, you can transpose rows to columns to display row field values in columns and column field values in rows. This makes extracting insights from large datasets straightforward.
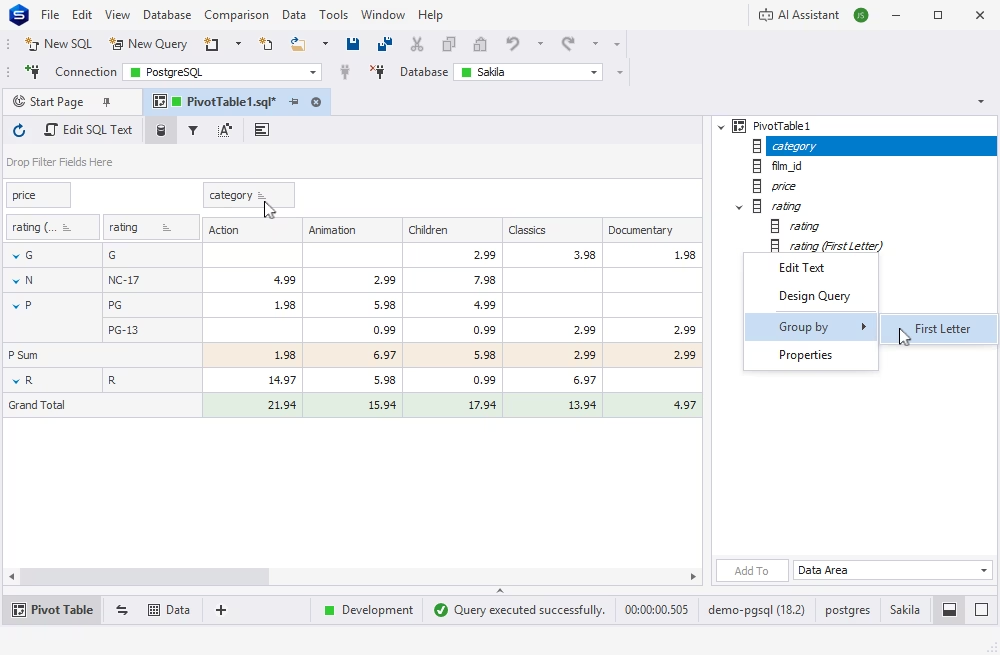
Data in a pivot table can be sorted and grouped to reveal relationships, patterns, and trends.
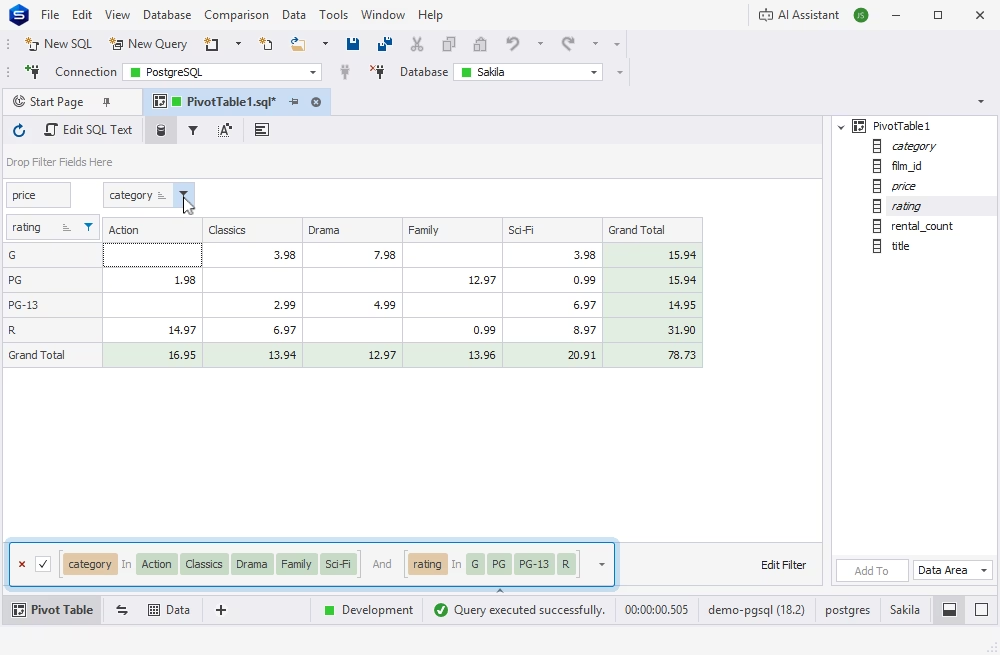
You can also use filters to display only the required data in your pivot table. Click the filtering icon on the field header and select the values to be displayed. It is also possible to create custom filters.
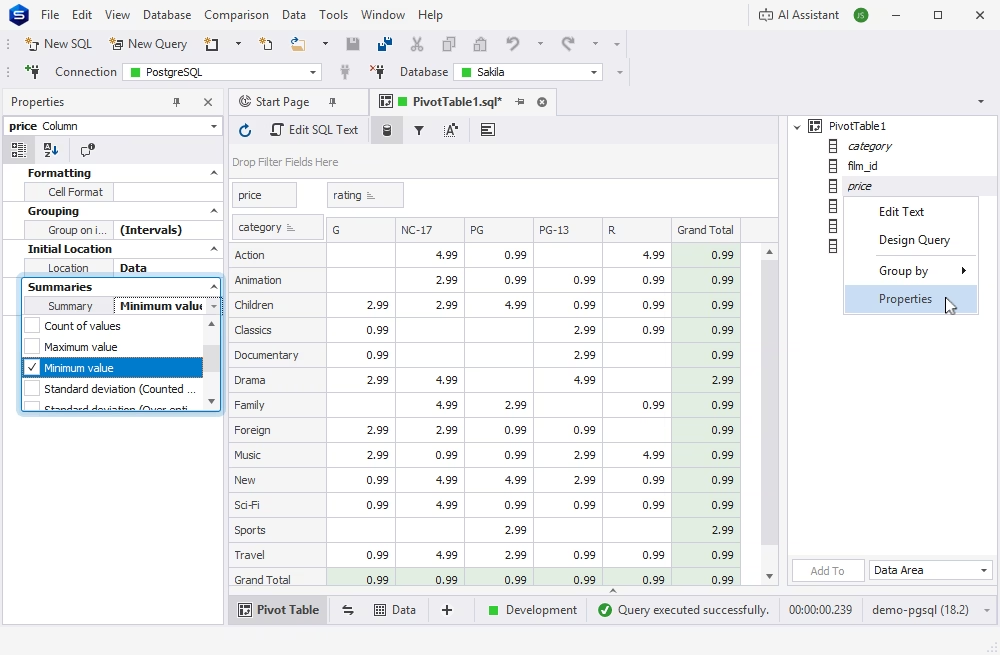
The pivot table offers a number of summary functions that you can apply to the required column or row fields to calculate custom totals for their values. Custom totals are displayed in additional rows or columns, highlighted in color.
The sum values are calculated by default, and you can see them immediately after adding row and column fields in a pivot table. You can also apply a different summary function if required:
When working with data, pivot tables are a powerful way to summarize information and uncover insights quickly. In PostgreSQL, however, creating pivot tables is not always straightforward. While the built-in crosstab() function provides pivoting capabilities, it requires additional setup and has several limitations compared to the intuitive drag-and-drop experience offered by GUI tools. The table below highlights the key differences between using crosstab() in PostgreSQL and creating pivot tables in dbForge Studio.
| Task | PostgreSQL crosstab | dbForge Studio Pivot Table |
|---|---|---|
| Create pivot output | Requires SQL and defined columns | Visual drag-and-drop |
| Change row/column layout | Rewrite query | Drag fields |
| Filter data | Add SQL conditions | Use visual filters |
| Create charts | Requires external tool | Built-in chart view |
| Handle changing categories | Requires dynamic SQL or query updates | Easier visual reconfiguration |
PostgreSQL can produce pivot tables, but there are a few recurring pain points. Here are the most common pivot table problems in PostgreSQL:
crosstab() requires a predefined output structure
The tablefunc extension helps but introduces its own constraint: users must explicitly declare output columns. So even though it pivots rows, it is still not truly dynamic.
Dynamic pivots require SQL generation.
When categories are unknown or changing, PostgreSQL cannot automatically generate columns. Instead, it requires you to query distinct values first, then build a query that relies on those values, and execute it. This aspect adds complexity and makes debugging harder.
Handling NULLs and missing values
Pivot results often contain NULLs when no matching rows exist. This leads to an extra cleanup step to avoid incomplete or misleading data in reports.
Complex aggregation queries
Pivot tables require aggregation functions (COUNT, SUM, etc.), and mistakes are easy to make—especially when working with large datasets that demand solid SQL knowledge.
Readability and performance considerations
Poorly written pivot queries can be expensive because they scan every row and evaluate it against multiple CASE conditions and perform multiple aggregations in a single pass.
This is why SQL pivots are often paired with GUI tools rather than used alone.
Pivot tables provide interactive data visualization that is vastly superior to the crosstab() capabilities in PostgreSQL. This feature offers flexibility and functionality for summarizing large data sets, which allows, among other things, creating charts for both all data and a selected data range.
You can try the dbForge Studio for PostgreSQL tool in practice: just download a fully functional free trial, install it, and see for yourself that extracting significance from a large, detailed data set has never been easier.
PostgreSQL doesn't have a native PIVOT operator. However, you can still build pivot tables in PostgreSQL using other methods, such as the built-in crosstab() function or conditional aggregation, to replicate PIVOT functionality.
There are several ways to create pivot tables in PostgreSQL. First, there's the crosstab() function from the tablefunc extension, which serves as the primary tool for creating cross-tab reports. Another approach is conditional aggregation, where you use CASE expressions to place values into the desired columns and then aggregate the results with functions like SUM(), MAX(), or COUNT(). Finally, some GUI tools offer visual ways to build pivot tables. dbForge Studio for PostgreSQL, for instance, includes a built-in Pivot Tables feature that lets you create a pivot table from selected data in just a few clicks.
The crosstab() function in PostgreSQL is the primary tool for turning rows into columns, allowing you to create a pivot table directly within your database queries. It's part of the optional tablefunc extension, so you'll need to install tablefunc for each database before using crosstab().
In PostgreSQL, you can pivot rows to columns using the built-in crosstab() function, conditional aggregation, or a dedicated GUI tool like dbForge Studio for PostgreSQL, which lets you pivot rows to columns visually.
Yes. You can use conditional aggregation to pivot data, though this method is a bit more involved: first, you group records by identifier; then you apply CASE statements to set the conditions for pivoting the data; and finally, you apply the necessary aggregate function to get the desired results. Another option offers visual pivot tables in dbForge Studio for PostgreSQL, where you can create a pivot table in just a few clicks and also reorganize, sort, group, and filter the data.
Dynamic pivot tables imply that the values aren't known in advance or may change over time. This creates a challenge, since PostgreSQL requires all columns to be specified in the query upfront and can't automatically generate new columns as new categories appear. You first need to query the database to discover the distinct category values, then use PL/pgSQL to construct a string that contains the SQL statement for each new column. As a result, pivot tables in PostgreSQL aren't truly dynamic.
The simplest option is to use a dedicated GUI tool, such as the Pivot Tables feature in dbForge Studio for PostgreSQL. This tool lets you create pivot tables visually, without writing any SQL queries, and requires no extra steps for handling dynamic pivot tables. All you need to do is select the table or view and specify which row you want to turn into a column.
Yes. dbForge Studio for PostgreSQL includes a dedicated Pivot Tables tool that lets you visually pivot data from rows to columns. Simply launch the tool, specify the table you want to pivot, and define the rows and columns. The whole process takes just a couple of clicks.
Yes. The Pivot Tables tool supports filtering, sorting, and grouping pivoted data for better organization and convenience.
Yes, dbForge Studio for PostgreSQL offers a tool that automatically creates charts from pivot tables in various formats. It also includes a Chart Designer, which lets you modify the generated chart or design your own to suit your needs.
Yes, dbForge AI Assistant can generate SQL queries to create pivot tables for your database. Simply select the database where you need the pivot table and describe the task in AI Chat. The AI Assistant will generate the query within seconds and let you execute it immediately against the target database.
Yes, dbForge AI Assistant can convert a regular SQL query into a pivot query. Just describe the task to the Assistant, and it will generate the necessary query for you within seconds.
Yes, dbForge AI Assistant can generate crosstab queries. Just tell the Assistant that you need a query using crosstab() and specify what data you want to retrieve. However, make sure to install the tablefunc extension on the target database first so you can execute the query immediately and view the results.