

dbForge Studio for PostgreSQL
AI-powered IDE for database development, management, and data analysis across PostgreSQL and related cloud services
If your PostgreSQL queries return wrong results, your stored procedures do not perform as expected, or your application slows down, you need a tool that shows you what is actually happening inside your database—an advanced PostgreSQL debugger. dbForge Studio for PostgreSQL provides a visual tool for debugging SQL queries, stored routines, and other database logic, helping developers trace problems, inspect execution plans, and pinpoint performance issues without switching between multiple tools.
In this intuitive debugging environment, you can step through code, examine variables and execution flow, analyze how queries are processed, and quickly identify the root cause of errors. From syntax mistakes to slow JOINs, everything you need to debug your code is available in one workspace.
A PostgreSQL debugger is a tool or set of tools that helps developers find, understand, and fix problems in PostgreSQL code and database logic. The term can refer to several debugging workflows rather than a single tool or approach. Depending on what you're troubleshooting, you may use a debugger to step through PL/pgSQL functions and procedures, inspect parameters and variables, identify errors in SQL scripts, troubleshoot triggers, or investigate why a query is running slowly.
PostgreSQL debugging can start with simply finding a syntax or runtime error in a SQL statement. A debugger can help identify where execution fails and provide information about the error, making it easier to correct the code. When working with functions or procedures, debugging becomes more complex: developers may need to check whether parameters contain the expected values, follow the execution flow, inspect variables, and determine which part of the logic produces an unexpected result.
In practice, PostgreSQL debugging may involve several tasks that complement each other:
PostgreSQL debugging can involve two fundamentally different tasks: debugging database code and debugging query performance. Although both aim to identify and resolve problems, they require different approaches. Code debugging focuses on whether procedural database logic behaves correctly, while query performance debugging focuses on how efficiently PostgreSQL executes SQL statements.
| Aspect | PostgreSQL code debugging | Query performance debugging |
|---|---|---|
| Primary goal | Find errors or incorrect logic | Find performance bottlenecks |
| Main focus | Functions, procedures, triggers | SQL queries |
| What you inspect | Variables, parameters, control flow, exceptions | Execution plans, scans, JOINs, filters |
| Typical tools | Breakpoints, stepping, variable inspection | EXPLAIN, EXPLAIN ANALYZE, query profiling |
| Common problems | Incorrect logic, unexpected values, runtime errors | Slow execution, inefficient plans, excessive I/O |
| Key question | Why does the code behave incorrectly? | Why does the query run inefficiently? |
The PostgreSQL debug tool available in dbForge Studio helps you identify and troubleshoot problems in SQL and database code without relying solely on trial and error. When a procedure or function doesn't behave as expected, you can step through its execution, inspect values, and pinpoint the part of the code that causes the problem.
Using the Debugger, you can pause the execution of functions, procedures, trigger functions, and event trigger functions at certain logical points to track the execution and evaluate the variables used in each statement. For that purpose, you can set breakpoints in your SQL to mark the points where execution must be paused.
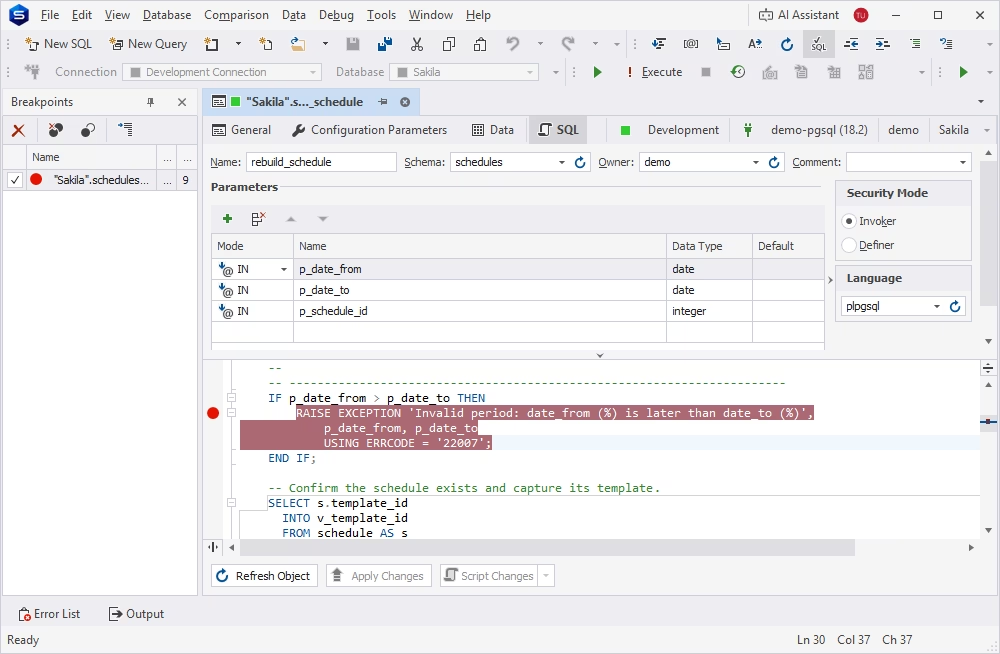
For a deeper analysis of SQL execution, you can choose to Step Into a specific statement or Step Over it. Whenever SQL execution pauses at a breakpoint, you can continue debugging either inside another called function or routine or at the next statement.
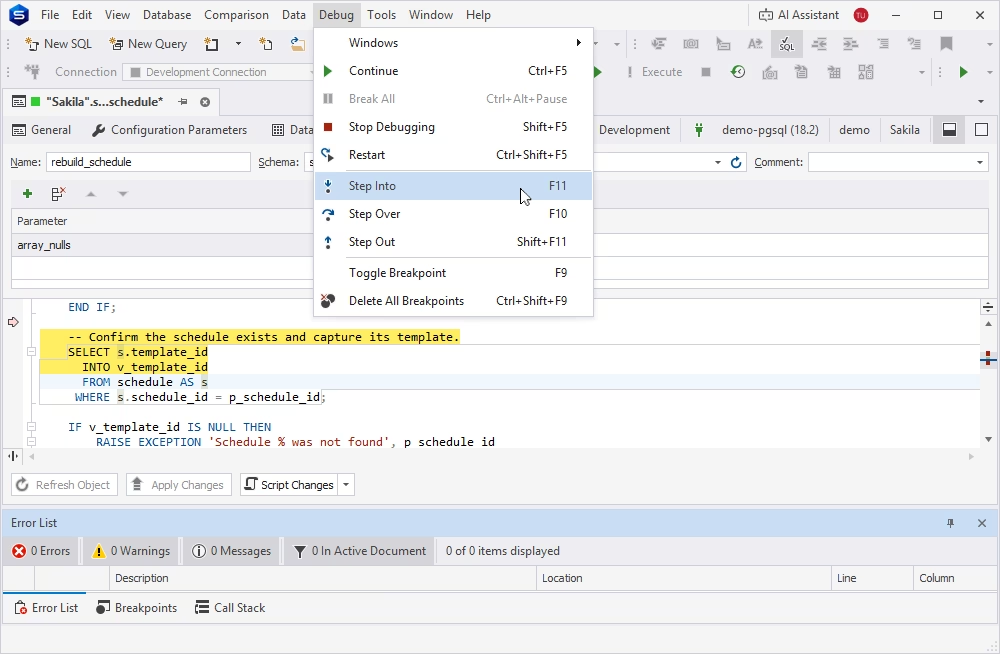
Many real-world SQL scenarios do not run in isolation—they receive parameters from an application. When you are debugging a function, procedure, or trigger, dbForge Studio, an advanced GUI tool for PostgreSQL, lets you run and check parameterized statements directly in the editor, so you can reproduce the exact flows your application generates and confirm that your code behaves correctly for different input values before it ever reaches production.
For application-driven SQL, parameters can be used to reproduce different input scenarios. In dbForge Studio for PostgreSQL, parameter values can be supplied through the Edit Parameters dialog. This is particularly useful when troubleshooting procedures, triggers, or functions that behave differently depending on user input or application-supplied values.
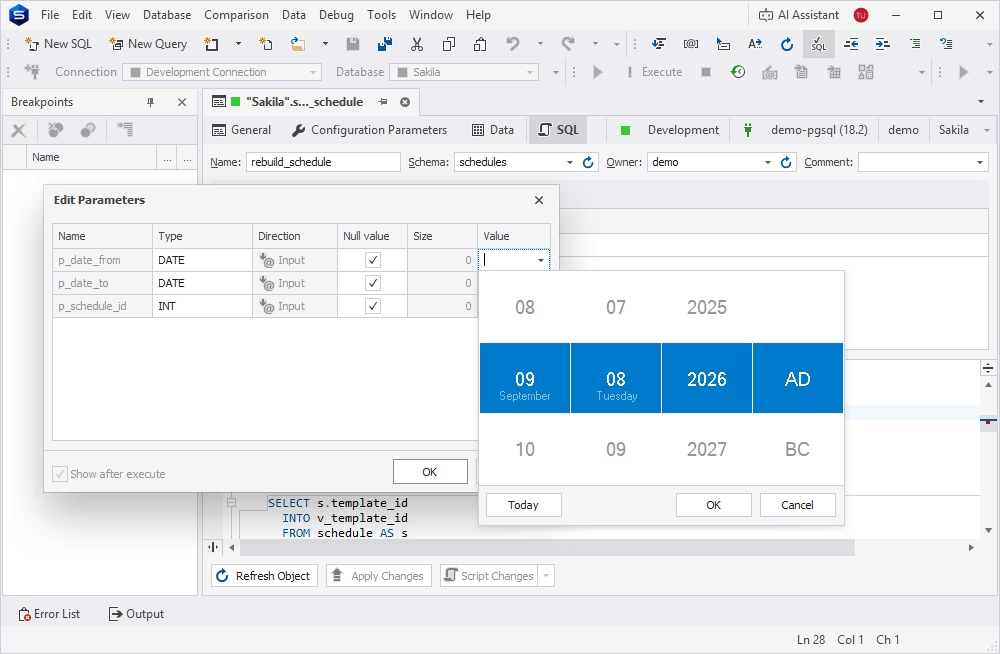
To monitor parameter behavior as the procedure executes, you can use Watches, a Debugger feature that allows you to track values and their changes between procedure steps. Watches can help you detect unexpected values, investigate incorrect results, and follow calculations involving multiple variables.
Not every PostgreSQL problem is an actual error. A query can be syntactically correct, return the expected results, and still perform poorly. Slow queries, excessive resource consumption, and inefficient execution plans can become significant problems as databases grow and workloads become more complex. PostgreSQL query performance analysis helps developers understand what happens during query execution and identify the operations responsible for delays.
PostgreSQL Query Profiler offered in dbForge Studio provides a practical way to investigate query performance by helping you identify queries and operations that take significant time to execute. Instead of examining SQL code, you can analyze actual execution behavior and take optimization measures that produce the greatest performance impact.
Visual execution plans in dbForge Studio for PostgreSQL turn the database's internal query plan into a diagram you can actually read. Instead of parsing raw plan output, you can see how PostgreSQL processes your query step by step: which tables are scanned, how JOINs are performed, and where the engine spends most of its time. For example, the plan can show whether PostgreSQL uses an index or performs a sequential scan, which JOIN strategies it chooses, how many rows each operation processes, and where execution time is concentrated.
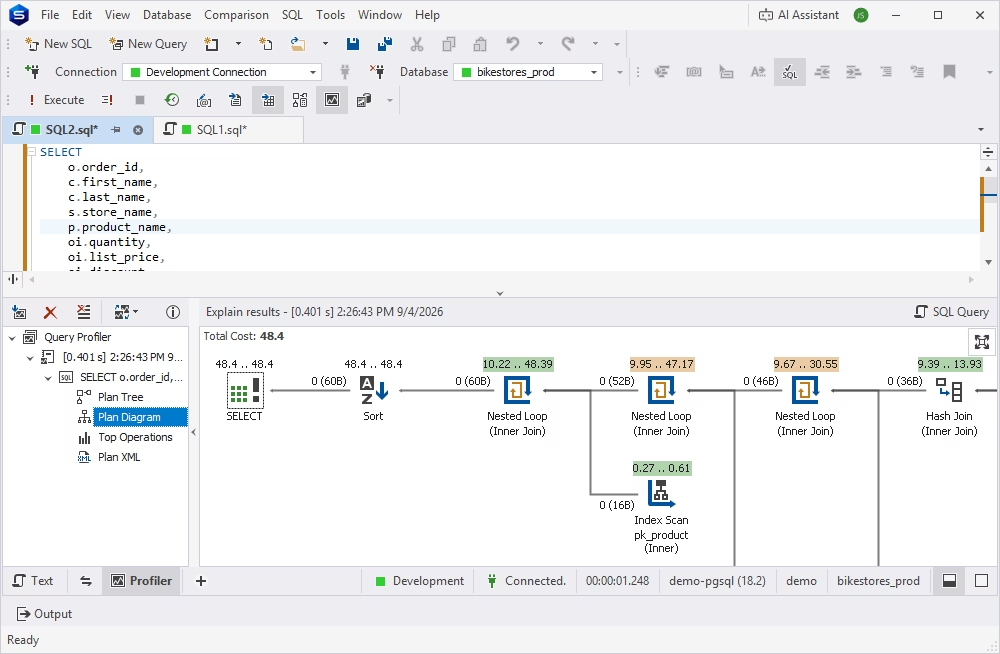
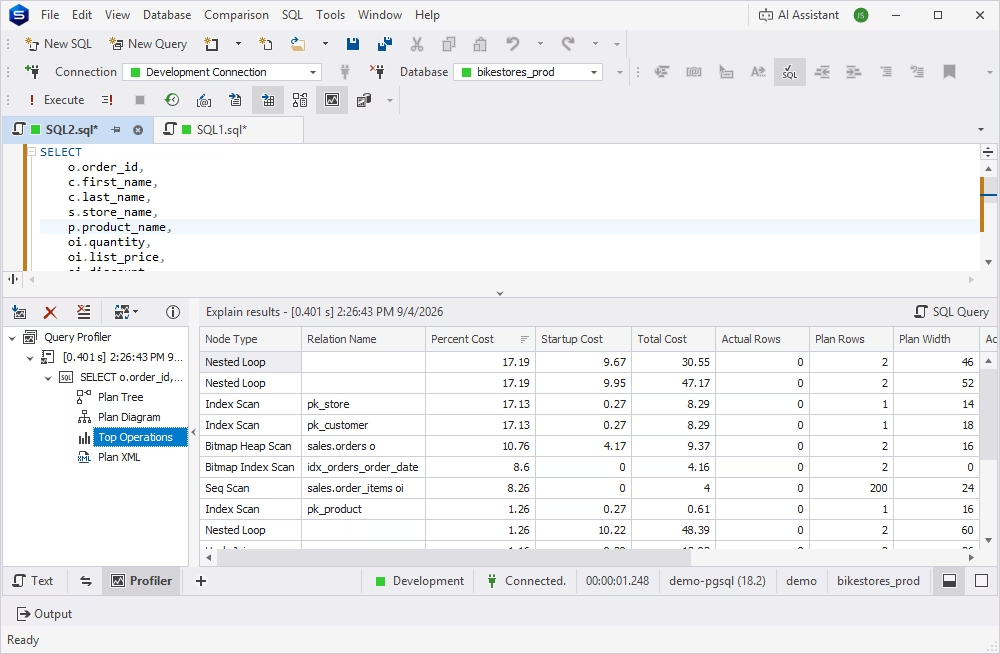
Query Profiler provides a practical way to investigate query performance by helping you identify queries and operations slow down the execution and consume excessive resources. With a clear view of the execution plan, you can pinpoint the most expensive operations in a query and optimize your SQL based on how it actually behaves. A query may appear straightforward but spend most of its execution time performing a large table scan, joining millions of rows, sorting a substantial result set, or applying filters inefficiently. Profiling helps you reveal these expensive operations and determine what needs to be optimized.
The Studio's integrated AI Assistant gives you another effective way to speed up debugging. When a PostgreSQL query fails, understanding the error is often the first challenge. AI Assistant can help you interpret SQL errors, identify potential causes, and suggest ways to correct them. Instead of searching through documentation or trying to diagnose an unfamiliar error from scratch, you can rely on the Assistant and its vast SQL knowledge to get a clearer explanation and practical suggestions directly within your database development environment.
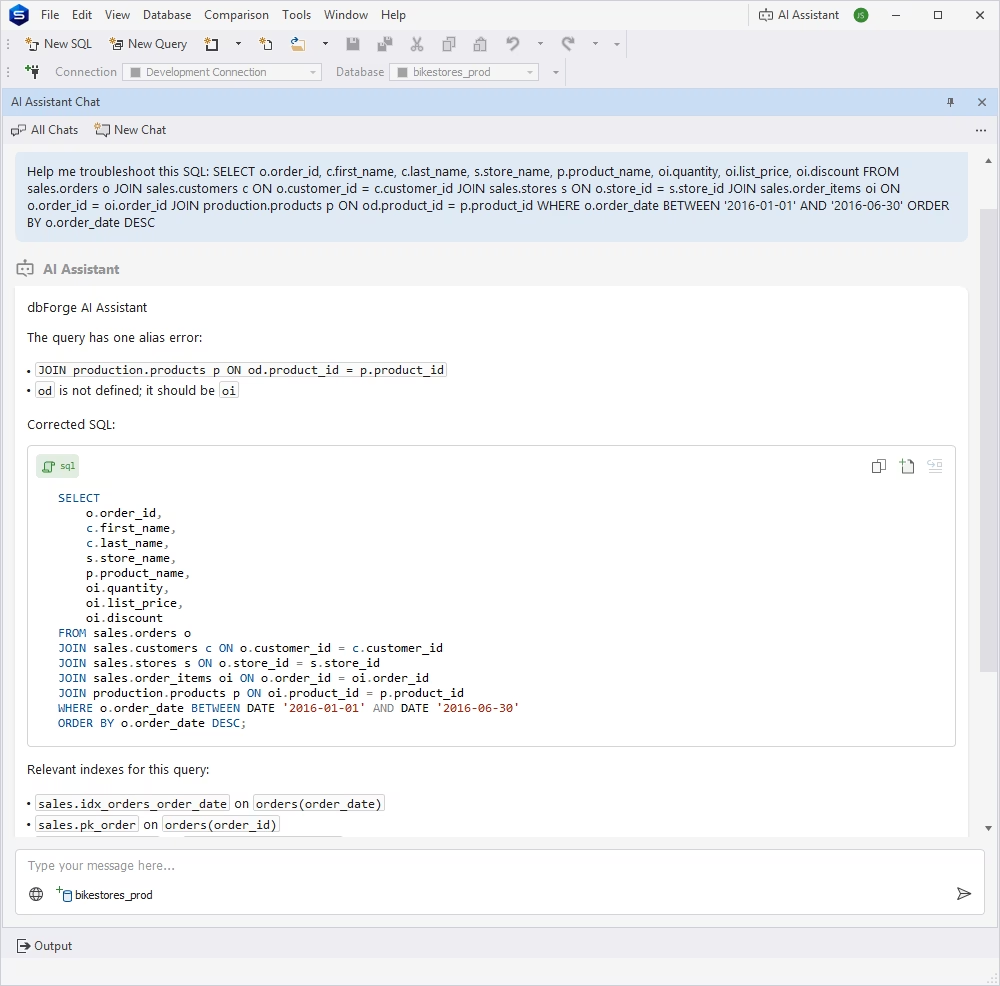
When you are debugging PostgreSQL code, the AI Assistant can help you by:
| Feature | Description |
|---|---|
| SQL editing | Assisting with code completion, formatting, syntax validation, and query execution |
| Error detection | Finding syntax errors, invalid references, and failed statements |
| Parameter support | Testing queries with custom input values |
| Query profiling | Analyzing slow queries and execution plans |
| AI Assistant | Explaining errors, suggesting fixes, and explaining SQL logic |
| Data editing | Checking data after running queries or scripts |
| Schema tools | Reviewing object definitions and database structure |
dbForge Studio for PostgreSQL provides a comprehensive development environment that brings SQL creation, debugging, query testing, database management, and performance analysis into a single PostgreSQL IDE. Instead of switching between separate tools to write code, investigate errors, examine query behavior, and work with database objects, you can handle these tasks within the same workspace.
This makes debugging part of a broader development workflow rather than an isolated troubleshooting activity. In a single, cohesive environment for managing the entire database lifecycle, you can improve database performance and code quality by finding and fixing errors and inefficiencies as you write SQL, preventing them from affecting your application at later stages.
Download dbForge Studio for PostgreSQL for a fully functional free trial and explore its capabilities designed to help you write high-performance, quality SQL.
A PostgreSQL debugger is a tool or set of tools that helps you find, understand, and fix problems in PostgreSQL code and database logic.
For standalone PostgreSQL queries, the best way to investigate performance is to use Query Profiler that helps you identify the most time- and resource-consuming operations.
If a query belongs to a stored procedure, function, or trigger, you can debug it using PostgreSQL Debugger offered in dbForge Studio. With this tool, you can analyze your SQL by:
If your PostgreSQL query performs correctly but slowly, the optimal way is to use Query Profiler available in dbForge Studio. Query Profiler allows you to find inefficient operations that consume excessive resources and take too much time. By analyzing execution behavior in a visual diagram and identifying the most expensive operations, you can see how your SQL can be optimized.
PostgreSQL debugging is focused on finding errors in SQL code or incorrect logic. Use debugging when you need to find why your SQL does not behave as expected.
PostgreSQL profiling is designed to locate performance bottlenecks and pinpoint operations that are too resource-intensive. Profiling is a method to use when you want to know why your queries run too slowly or consume too much CPU or memory.