Query Optimization with PostgreSQL Profiler
Query Profiler functionality helps trace, recreate, and troubleshoot problems in PostgreSQL Server. With the PostgreSQL Profiler tool, you can quickly and easily identify productivity bottlenecks and thus boost the overall performance and efficiency of your database system.
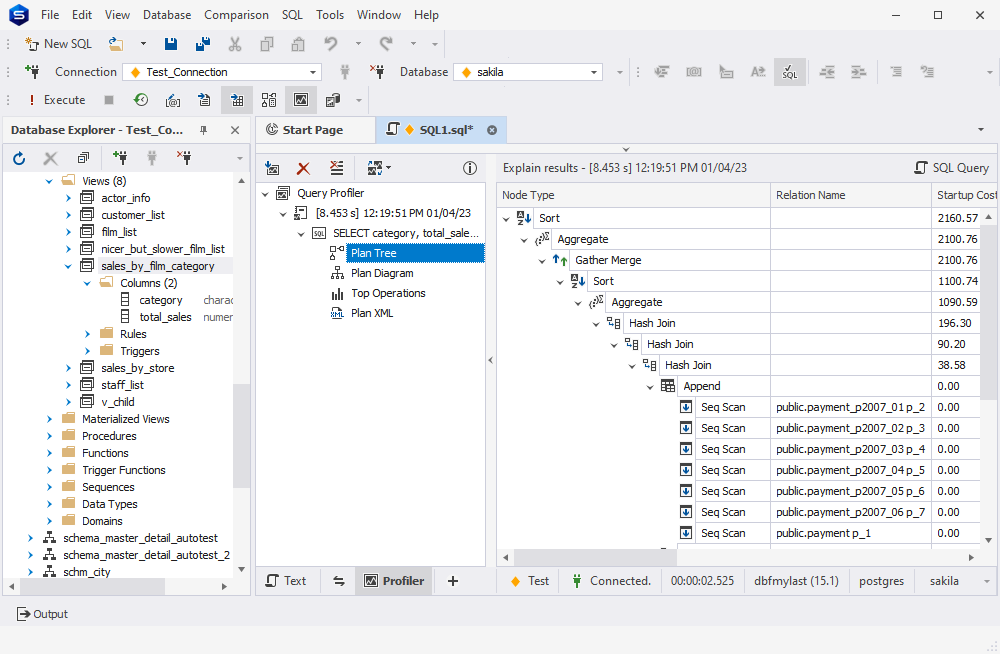
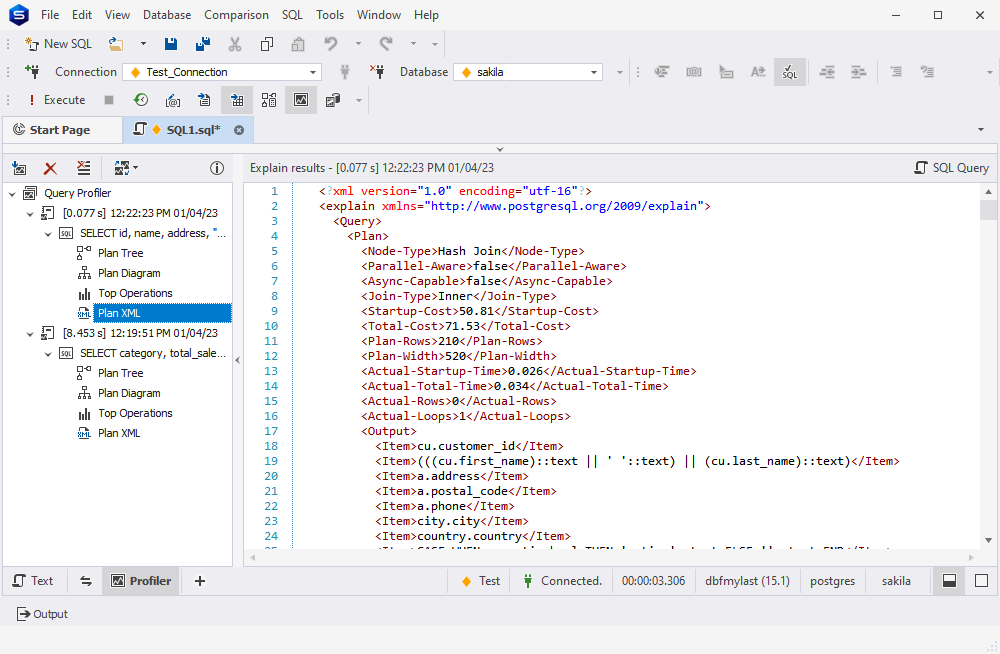
In order to tune Postgres queries in the most effective way, you can start with identifying queries that have the longest duration. PostgreSQL Profiler built into dbForge Studio for PostgreSQL helps accomplish this task in a few clicks. Next, you can analyze the queries to determine whether they can be optimized. For your convenience, the tool allows comparing the results before and after optimization. Stop wasting time on diagnosing and debugging - get the clear and automated way to profile your queries. With PostgreSQL Profiler you can:
- Quickly check PostgreSQL query performance
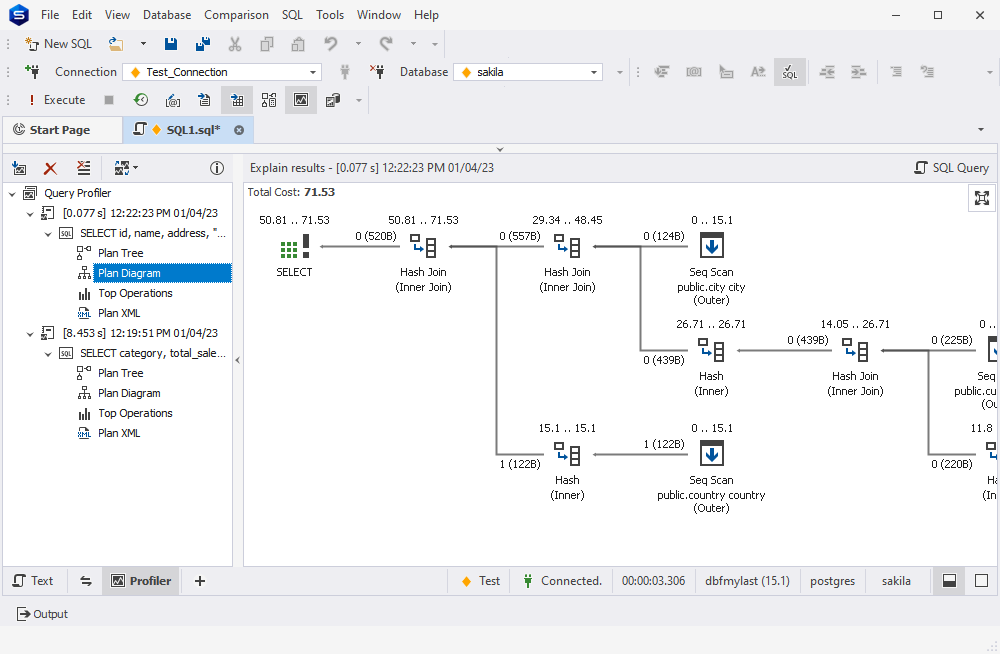
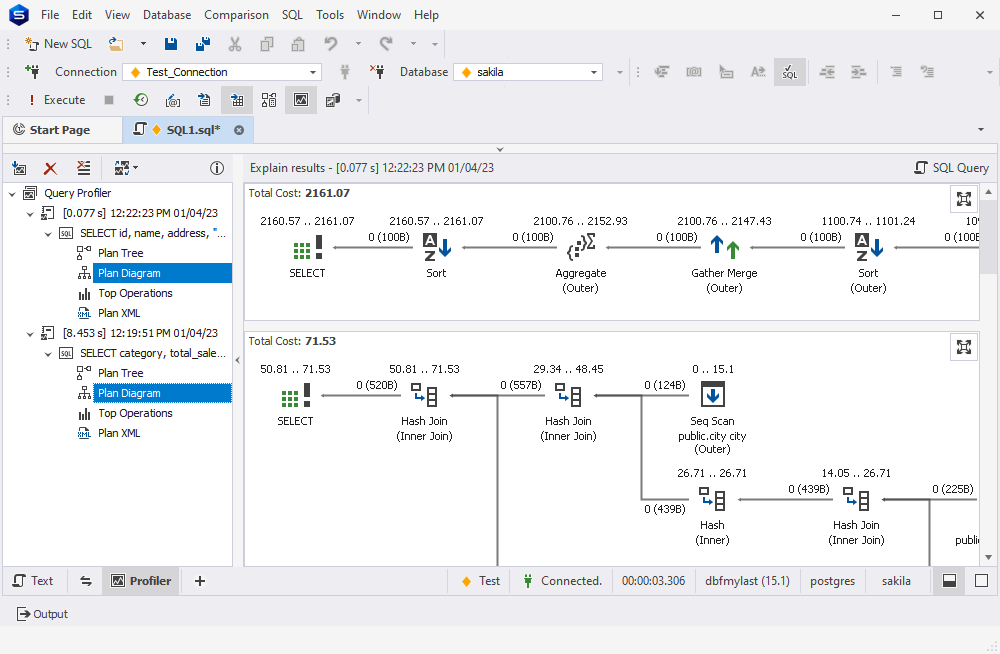
- Compare query profiling results visually
- Effectively analyze your PostgreSQL queries
- Achieve PostgreSQL query optimization
- Drastically improve PostgreSQL query performance
- PostgreSQL Profiler is compatible with Microsoft Windows XP/7/8/8.1/10/11