
Key Features of dbMonitor
Filtering and sorting events by type, SQL, description, status, duration and other parameters.
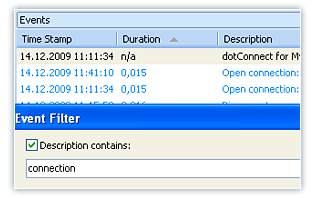
This option allows you to gradate transactions by above mentioned parameters. For example, this feature can be very useful for heavy transaction detecting. Also, it can be useful for locks detecting in run-time environment.
Multiple client processes tracing
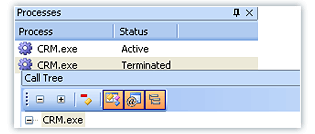
dbMonitor provides a monitoring of the different processes simultaneously. So, you can profile different applications and different databases at the same time. Also, you can profile different kinds of the applications - desktop applications, windows services, web applications.
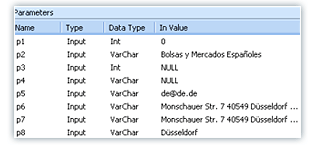
SQL parameter and error tracing.
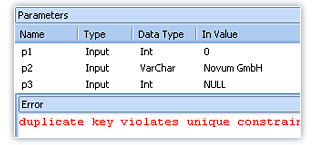
dbMonitor provides extension tools for complete query debugging and monitoring. You can see any parameter of your query. For SQL-statements with errors you can see database server error message.
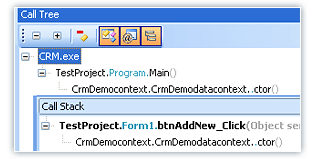
Call tree window for displaying merged call stacks and filtering events by calling method
This feature is provided only for monitoring ADO.NET providers.
This functionality provides history of the application and database interaction.
It contains the set of applications methods which calls SQL-statements. Also, information
about namespaces and methods parameters are presented.
Object Tree windows for filtering events by calling object
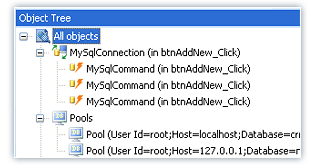
This feature is provided only for monitoring ADO.NET providers.
This functionality provides to you possibility to look ADO.NET objects, which are
used in your application. You can browse pools and single connections via help of
this feature and filter events by calling object.
Remote debugging
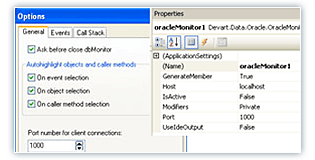
This option can help you to monitoring remote applications.
You have to define Remote host and Port Number properties for your
monitor component in MS Visual Studio IDE. It is settings of watch station. After
that you have to define port number in the dbMonitor tool. It is very useful, when
you need to monitor applications on the customers environment or on the web-server
(hosting).
Unicode support
dbMonitor provides unicode support. So, you can monitor multi-lingual applications and databases. There are no more undefined symbols!