Debugger for MySQL
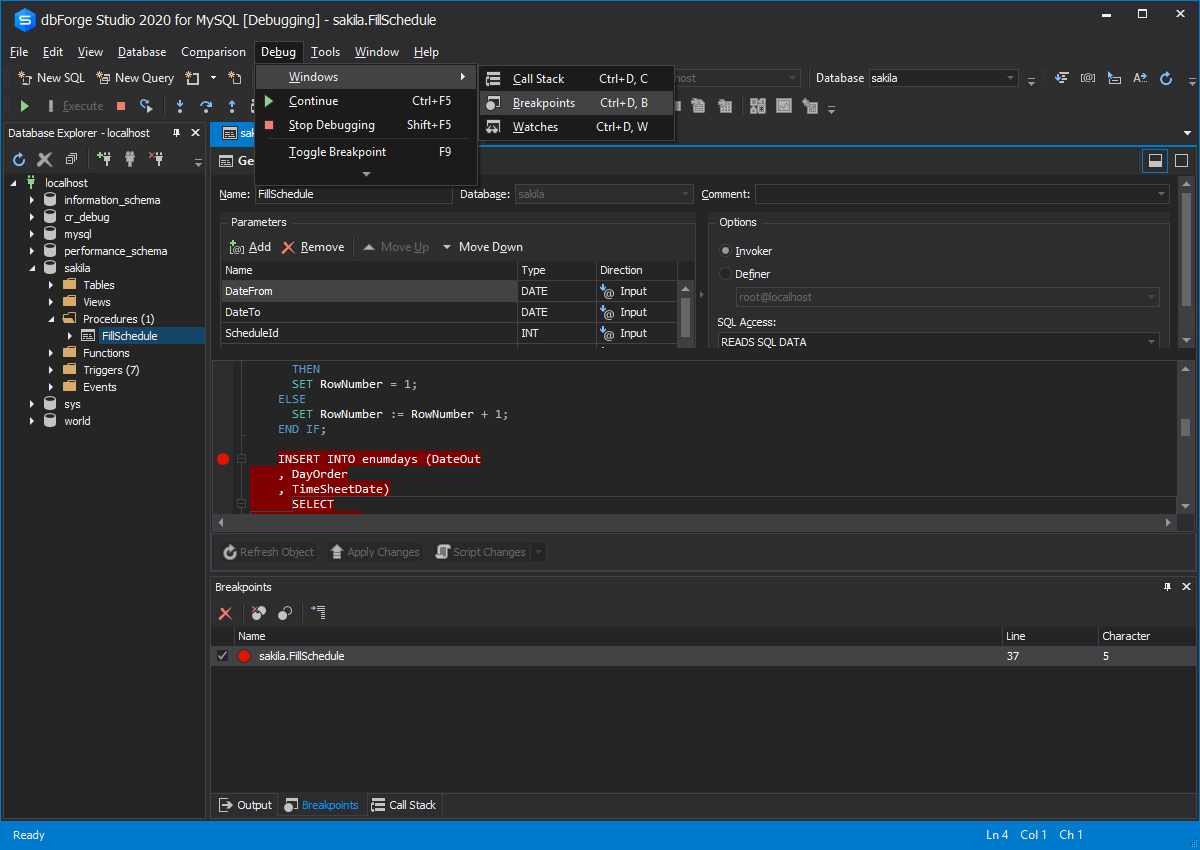
MySQL doesn't provide a built-in debugger for stored procedures, functions, and triggers. As a result, developers have to either manually output variable values or use workarounds that are not always effective. It becomes complicated to search and fix logical errors, especially in complex scripts, where error messages don't provide enough data for analysis. Moreover, most standard tools don't deliver essential features for effective debugging.
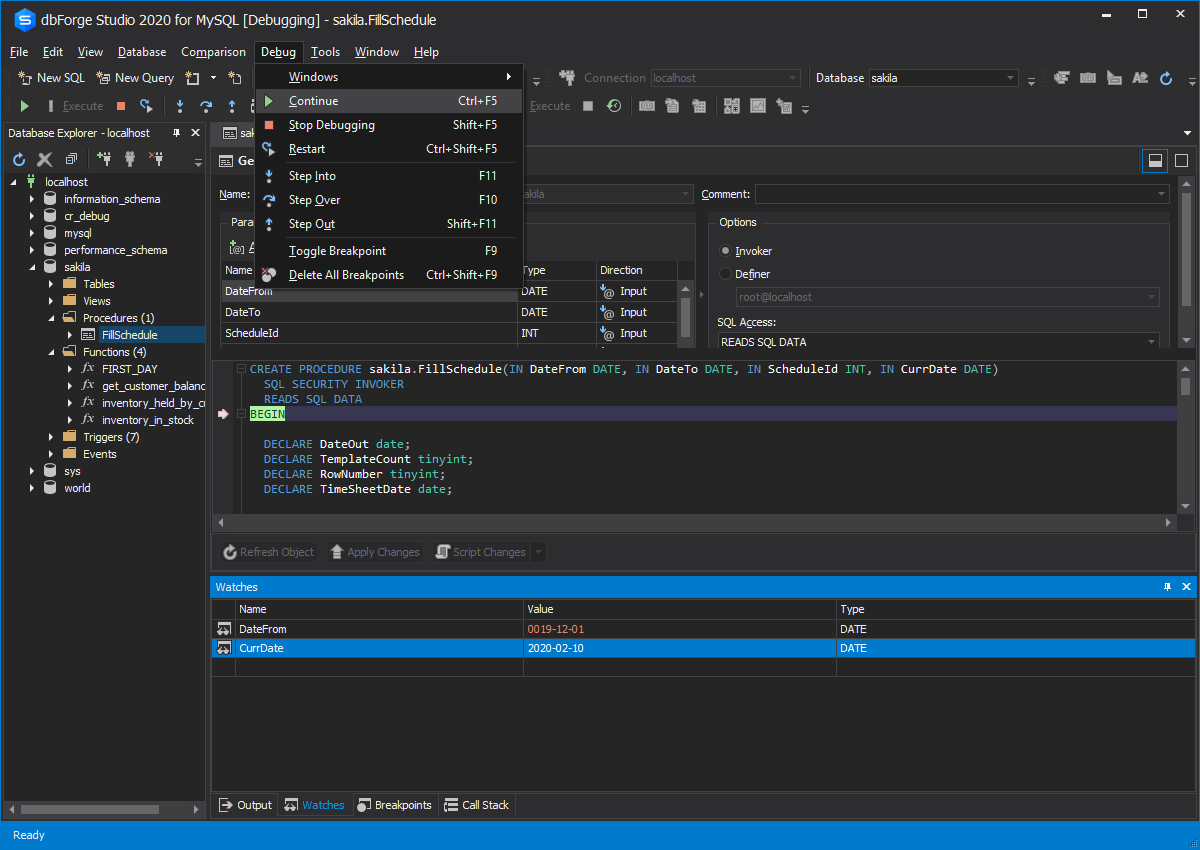
Database and software developers are the most affected by this issue. For them, it is crucial to quickly detect and debug stored procedures and functions without extra manipulations. An IDE with a powerful visual debugger can significantly simplify their work and save time. Managers face the consequences of this issue in the form of development delays, low team productivity, and increased load on the QA team. C-level executives view this issue through the lens of business efficiency: delays caused by technical challenges result in increased costs, risk of reduced product quality, and potential reputational damage.
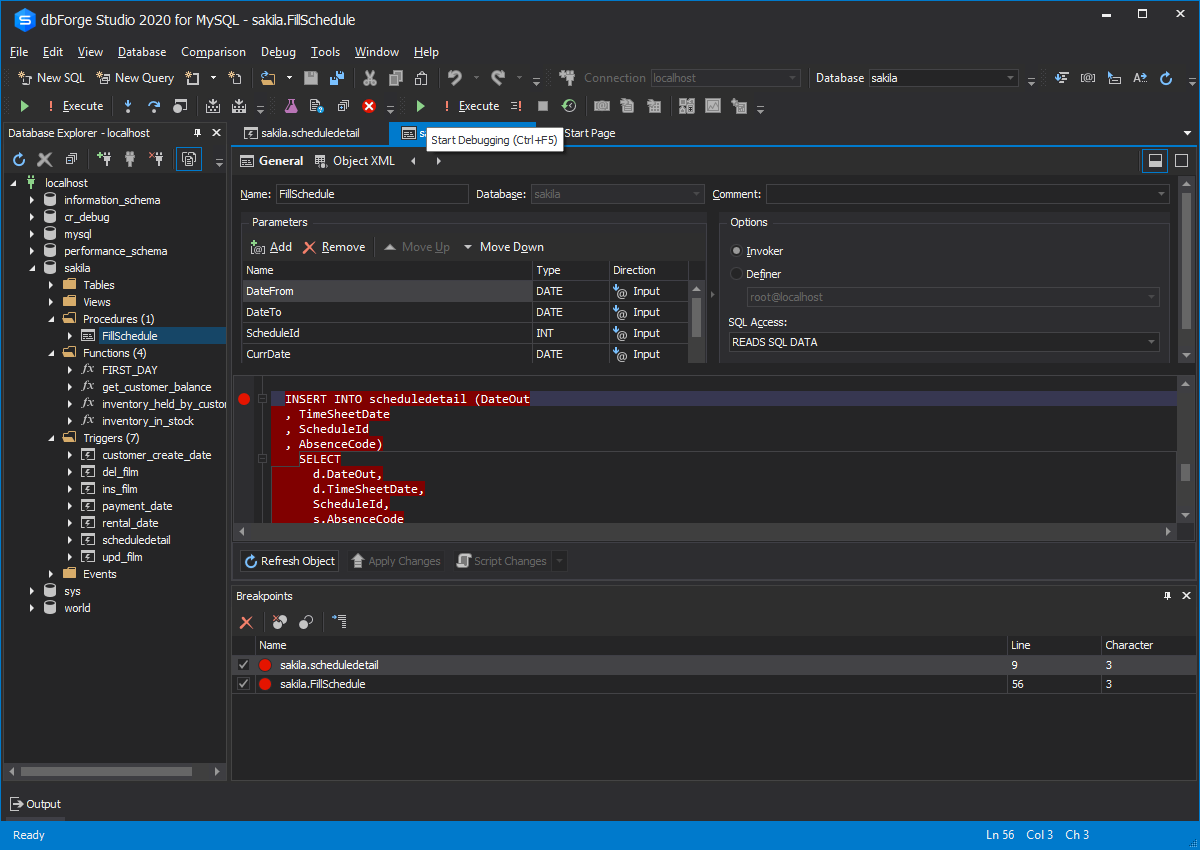
dbForge Studio for MySQL addresses a clearly defined problem faced by database developers and delivers tangible value at both the managerial and strategic levels. It is a prime example of a narrowly focused solution that resolves a deep technical issue while simultaneously having a positive impact on business performance.