Tune Performance using MySQL Query EXPLAIN Plan

MySQL EXPLAIN plan helps you understand how MySQL queries are executed and what indexing techniques are better for running queries efficiently. The EXPLAIN plan is a handy statement, especially when you need to optimize MySQL queries.

Everyone has experienced situations when executing long and complex queries takes much time and thus, makes the process slower and inefficient. In such cases, you need to understand why this happens and what you can do to tune your queries for minimum impact on database performance.

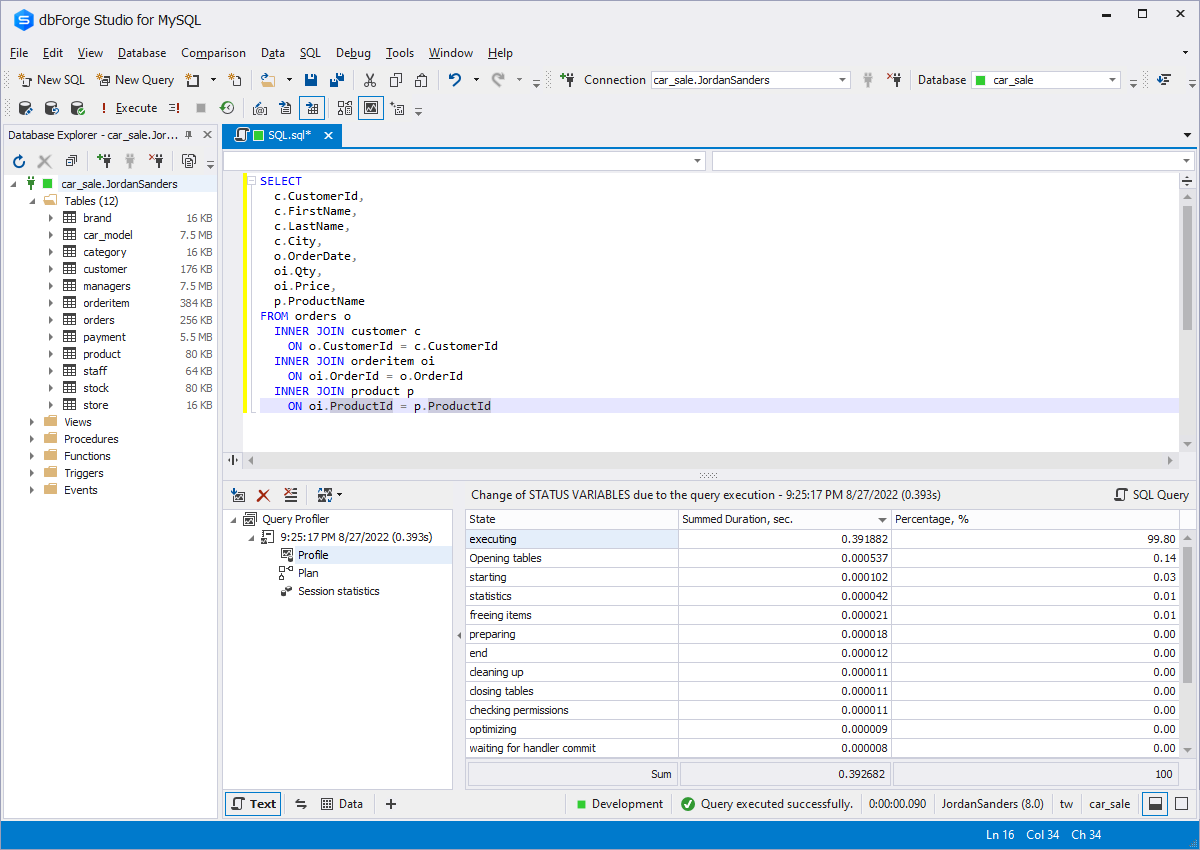
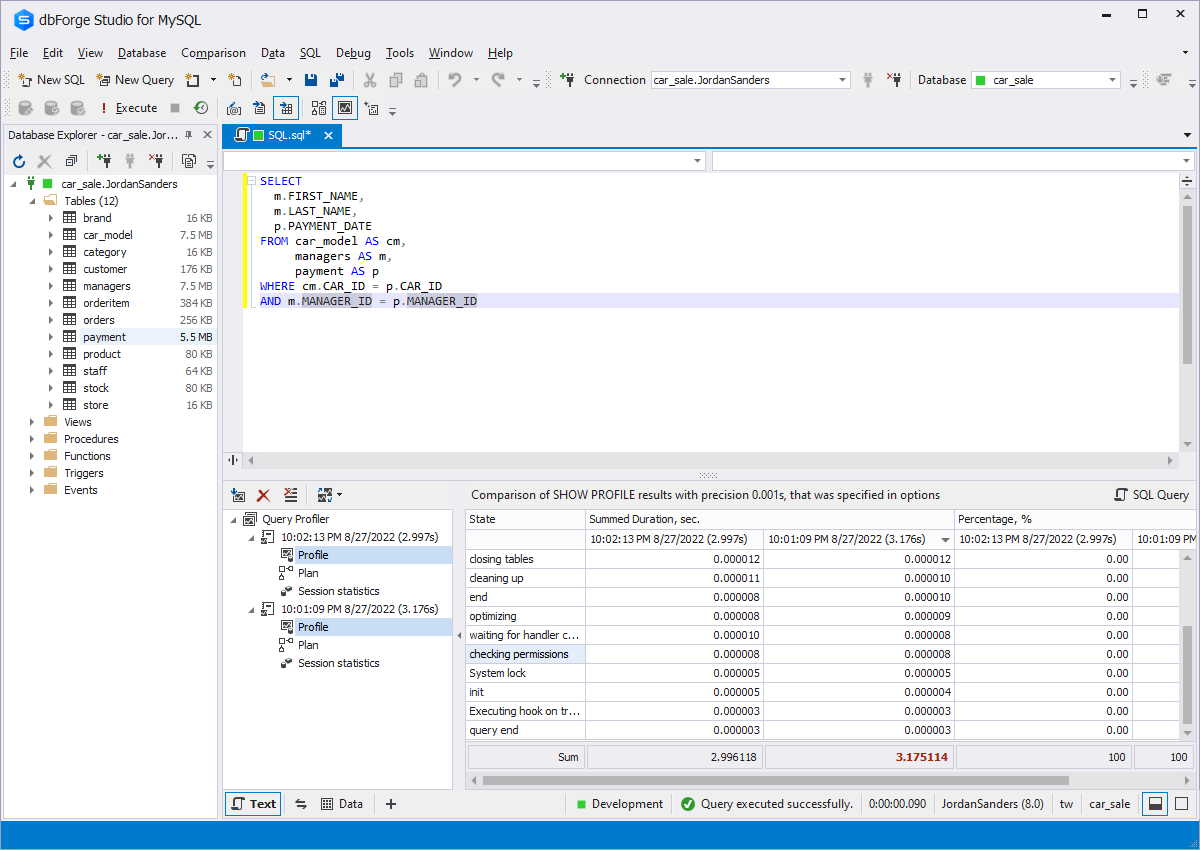
We offer an excellent solution to this issue Query Profiler built into dbForge Studio for MySQL. This tool allows you to:

  • Optimize and improve query performance
  • Tune queries to return data in the most efficient way
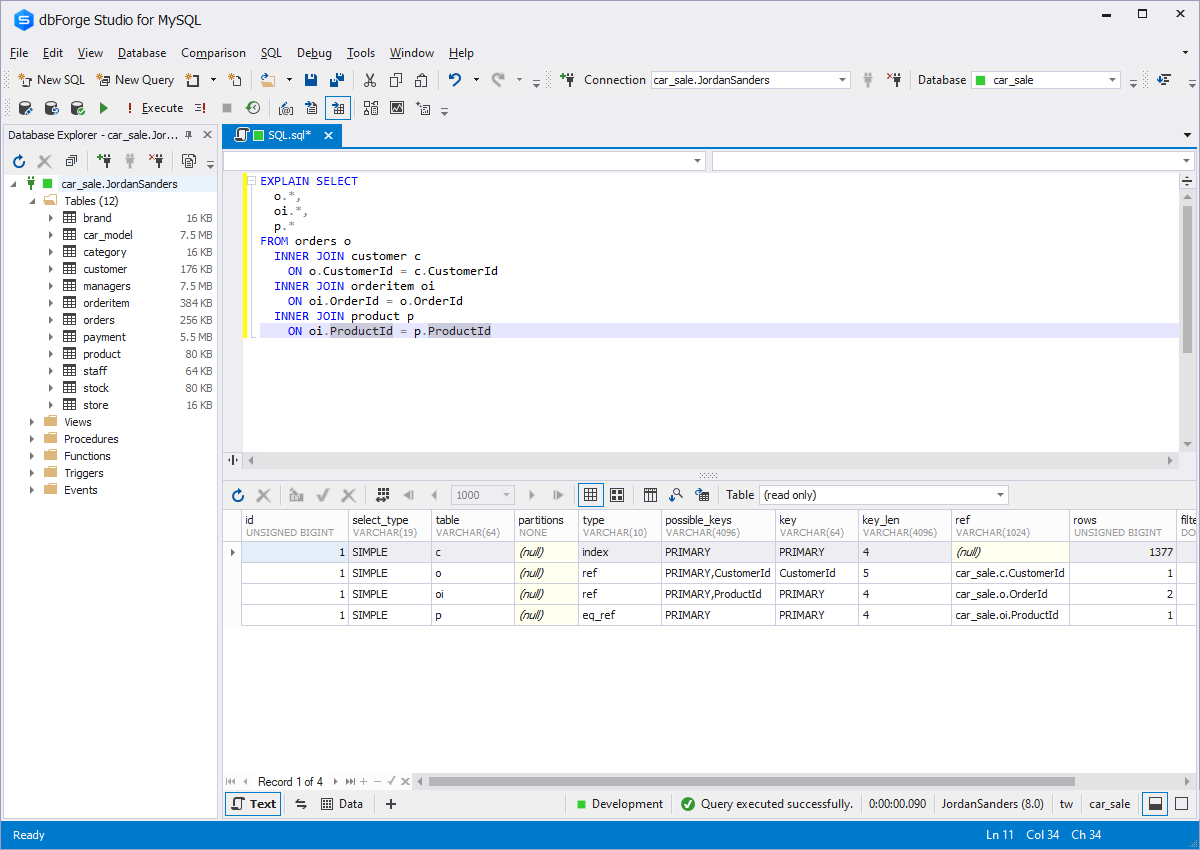
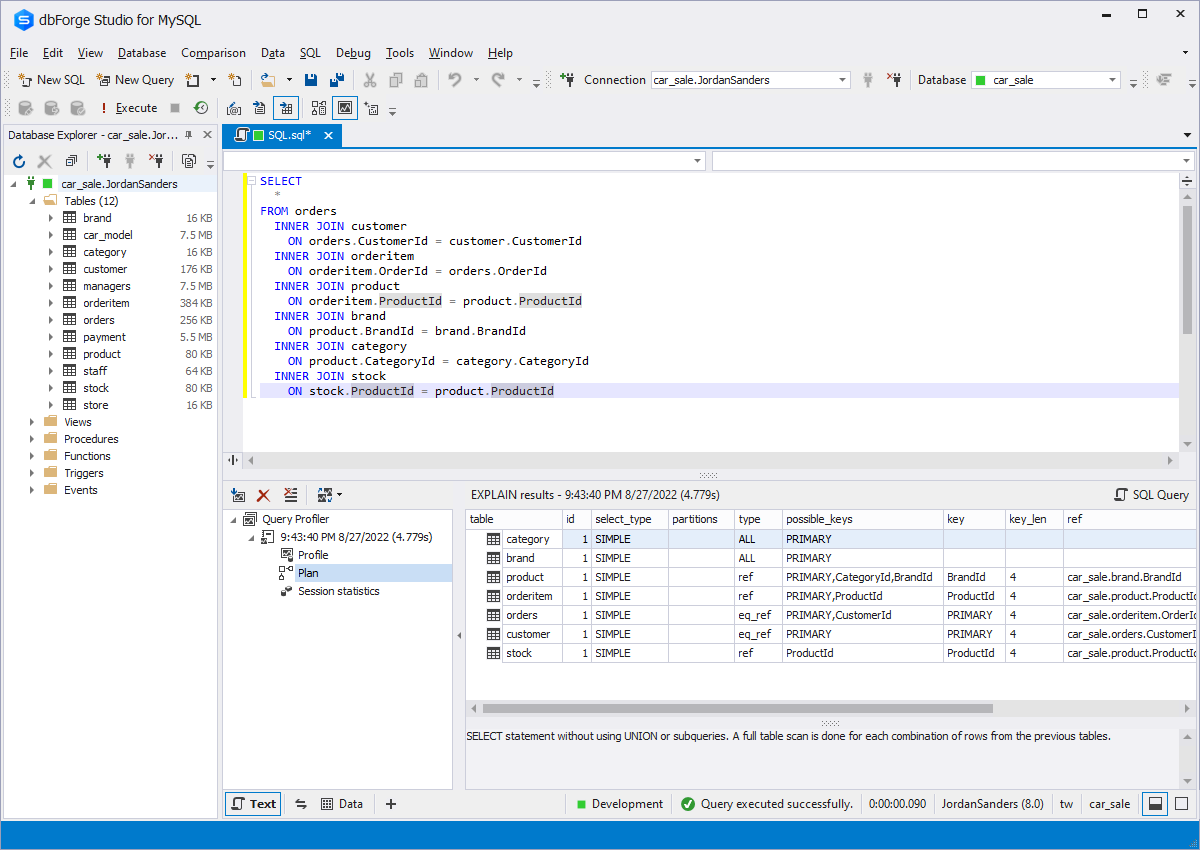
  • Visualize query tuning and monitoring with MySQL EXPLAIN plan
  • Analyze MySQL queries using the EXPLAIN plan, SHOW PROFILE results grid,
    and query statistics

Analyze and optimize queries with the EXPLAIN plan

We will show you a particular example of how to monitor and analyze MySQL query performance using Query Profiler.
Also, we will consider how to optimize MySQL query performance by using the MySQL EXPLAIN plan.

Execute MySQL query

Suppose we need to select all managers with the last date they made a car sale. You can use the SELECT statement for this.

Write the query and click Execute.

The results will be displayed in the table. You can view, edit and print data, export it to the most popular formats, filter by conditions, and much more.

Executing the SELECT query

Use Query Profiler for performance analysis

To get a complete picture of how a statement is executed, you can run it with the enabled Query Profiling mode.

Click Query Profiling Mode and then click Execute. The Query Profiler document view will get opened. As you can see, the query profiling results as well as time and date of query execution are displayed in the Query Profiler tree. The tree contains three informative tabs: Profile, Plan, and Session statistics.

Query Profiling Mode

What is MySQL EXPLAIN?

The EXPLAIN statement is used to retrieve information about how MySQL executes queries. It works with the SELECT, DELETE, INSERT, REPLACE, and UPDATE queries. In a statement, you should place EXPLAIN in the first place.

When you add EXPLAIN to the SELECT query, you'll get valuable data such as a query id and type, table name you execute a query for, partitions, JOINs types, possible indexes to choose, used indexes, etc. You can use this data to improve slow-running statements.

 Debugging MySQL triggers

What issues EXPLAIN can solve

You can run EXPLAIN when you want to know if a query does what it is supposed to do. To optimize troublesome queries, you should monitor data in each column of the EXPLAIN output depending on what you want to tune.

  • select_type: trace data in this column if you want to ensure that your queries take part in JOIN operations
  • partitions: data in this column can be helpful if you added partitions to a table and need to check what partitions a query uses
  • type: if you design queries, focus on data in this column
  • possible_keys: data in this column can inform you what indexes MySQL used
  • key: if you need to know what index MySQL selected, keep an eye on data in the column
  • key_len: the column displays the length of the selected index
  • ref: data in the column can be valuable to improve query performance by using indexes
  • rows: pay attention to data in this column if you design indexes inside database instances
  • filtered: it shows an approximate percentage of the rows in a table filtered by a particular condition
Query Profiling Mode

How to use MySQL EXPLAIN

To get deeper into the query performance process and analyze why it takes a long time to run a query or how queries are executed, you need to switch to the EXPLAIN Plan in the Query Profiler tree.

The EXPLAIN results grid displays what data is checked, how many rows are processed, and what indexes are used to run the query faster. Also, the Plan measures time spent on query execution and shows the conditions used to run the query. For example, the TYPE field of the EXPLAIN Plan can indicate how MySQL tables are joined or in which order they are accessed and processed.

EXPLAIN Plan tab

Best practices to optimize a slow query with MySQL EXPLAIN

In this section, we'll explain to you how to easily tune a slow-running query with the Query Profiler provided in dbForge Studio for MySQL. The FOREIGN KEY relationship plays the main part in this process as tables must be related to each other.

First of all, we created external keys for a table we wanted to execute a query for. Then, we just ran the query with the enabled Query Profiling mode. As you can see in the screenshot, there is a huge difference in the execution time: the first result is the time of the executed query with the keys and the second result is the time of the executed query without the keys.

Query Profiler result

MySQL Query Profiler

Watch the video to see the MySQL Query Profiler in action. Learn how it makes database development a whole lot easier and more efficient. In addition, it is a great optimization tool for tuning MySQL queries and investigating performance issues.

Conclusion

To sum it up, the MySQL performance monitoring tool and MySQL Query EXPLAIN Plan is better to use when you want to significantly increase query performance and optimize queries based on the output provided by the MySQL EXPLAIN plan, identify any bottlenecks that may affect database performance, and get the information to see which queries run slow.

dbForge Studio for MySQL

Download a 30-day trial of the most intelligent MySQL management tool
and you'll see how you can simplify and speed up your work

Availability in the editions of dbForge Studio for MySQL

Feature

Enterprise
Professional
Standard
Express
Execution plan tool
Yes
Yes
Yes
None