
dbForge Studio for PostgreSQL
AI-powered IDE for database development, management, and data analysis across PostgreSQL and related cloud services
Assessing and optimizing query execution plans are crucial for resolving specific performance issues and tuning overall server performance. Not only DBAs but also database developers and analysts need to track query efficiency to prevent performance degradation.
Let's look at different techniques and tools that can help analyze, monitor, and troubleshoot PostgreSQL query plans and then perform query optimization based on the received information.

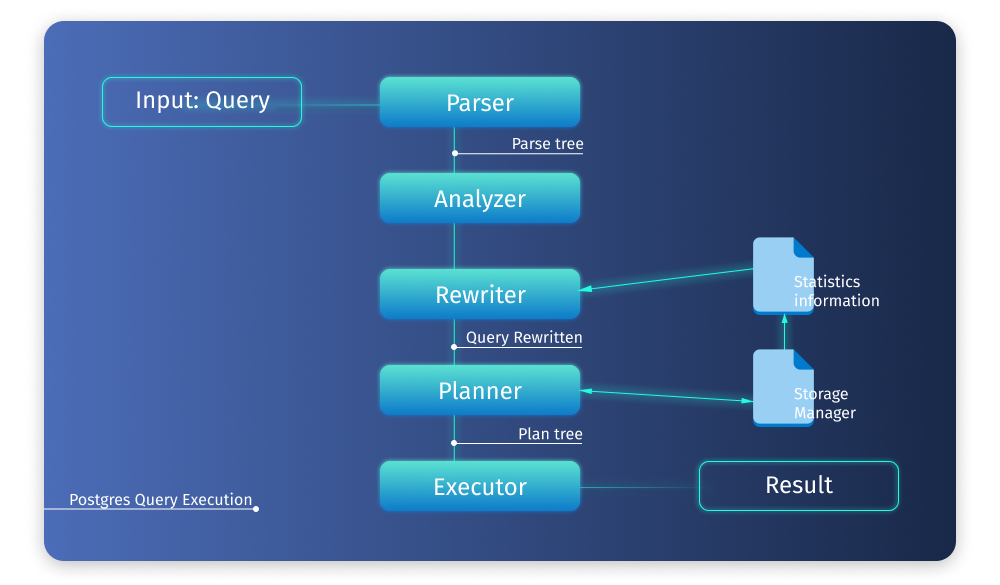
In PostgreSQL, an execution plan is a graphical representation of the steps involved in query execution. The query plan is generated by the query optimizer, which prepares multiple execution plans and then selects the most efficient one.
A query plan comprises a tree of nodes of different types. Each node may have one or more child nodes. Different nodes stand for different operations, but each parent node retrieves data from its child node row by row. The child node can either obtain data directly (for example, by retrieving it from database tables) or fetch it from its child node.
The PostgreSQL execution plan allows you to understand how you need to change the query to improve its performance.
One of the methods to analyze query performance in Postgres is by using the EXPLAIN command. It instantly shows the PostgreSQL query plan and its execution cost. In the PostgreSQL query plan generated with the help of EXPLAIN, you will also be able to see how the table or tables mentioned in the statement will be scanned, and in case multiple tables are queried, what algorithms will be used to join the required rows from each table.
The syntax of the EXPLAIN statement is as follows.
EXPLAIN [ ( option [, ...] ) ] SQL statement;Where the option can be one of the following:
ANALYZE [ boolean ]
VERBOSE [ boolean ]
COSTS [ boolean ]
SETTINGS [ boolean ]
BUFFERS [ boolean ]
WAL [ boolean ]
TIMING [ boolean ]
SUMMARY [ boolean ]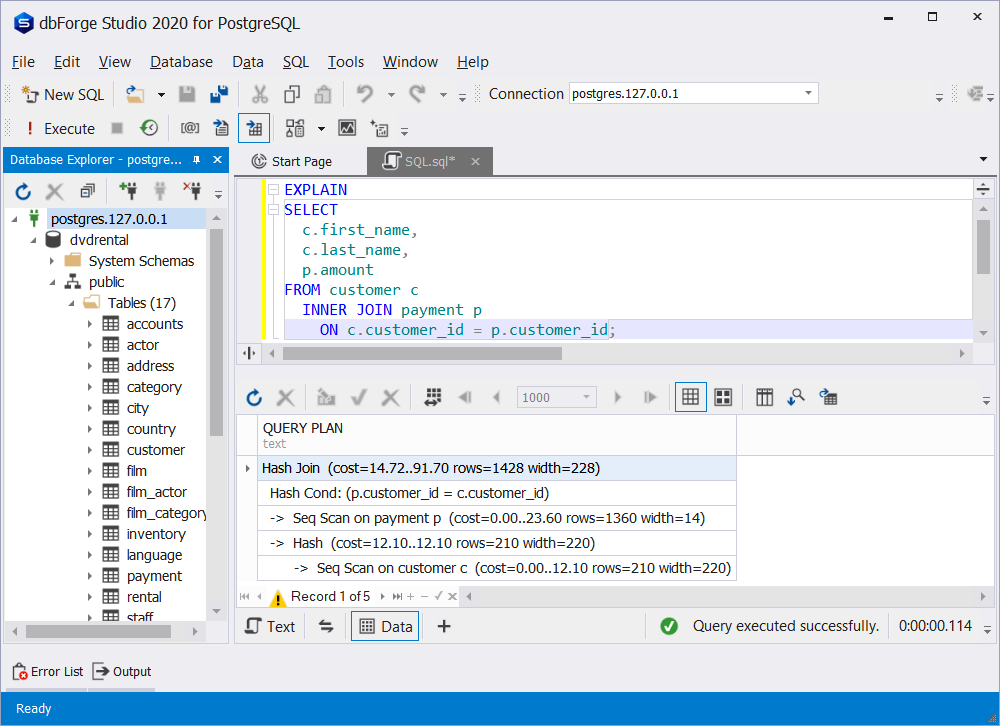
FORMAT { TEXT | XML | JSON | YAML }Interpreting query execution plans is crucial for all those interested in performance optimization. To be able to take advantage of the PostgreSQL execution plan, you need to clearly understand the information it provides. Let's have a detailed look at the execution plan statistics given in the screenshot below.
The first record of the query plan in question shows the join algorithm, its cost, the number of rows being joined, and the average size of one string in bytes. The second record displays the join condition. Next, the information on how the relation will be scanned is given. Seq Scan in our case means that each row of the table will be read in sequential order. Here you can also find a hint on the work of Seq Scan — the startup cost (the cost of returning the first row) and the cost of returning all the rows, the total number of scanned rows, and the average size of one string in bytes. Further, you will find similar statistics on the hash and scanning of the second table.
In PostgreSQL, the EXPLAIN ANALYZE query allows obtaining actual run-time statistics on the required statement. Note that, unlike EXPLAIN, EXPLAIN ANALYZE actually runs the query, which means that you need to be careful with the DROP and UPDATE statements.
In case you need to obtain the estimated plan and cost of a query but don't want to affect data, we recommend running the required query with a rollback. The syntax for this is as follows.
BEGIN;
EXPLAIN ANALYZE ...;
ROLLBACK;
EXPLAIN and EXPLAIN ANALYZE in PostgreSQL are quite similar, however, EXPLAIN ANALYZE returns more extended statistics on the query performance, adding the actual execution time and row count for each step. You can compare the two outputs in the screenshot below.

Lots of experts are widely using the EXPLAIN ANALYZE command in PostgreSQL to analyze query performance by monitoring how the query is run internally and identifying performance bottlenecks and opportunities for optimization.
The query planner determines the fastest way to reach database data by estimating the amount of time it takes to do a full table scan, merge the tables, and perform other necessary steps to output the result. To accomplish this, PostgreSQL estimates the costs of each step. Then, the query planner compares the cumulative costs for different query execution strategies and selects the most optimal one.
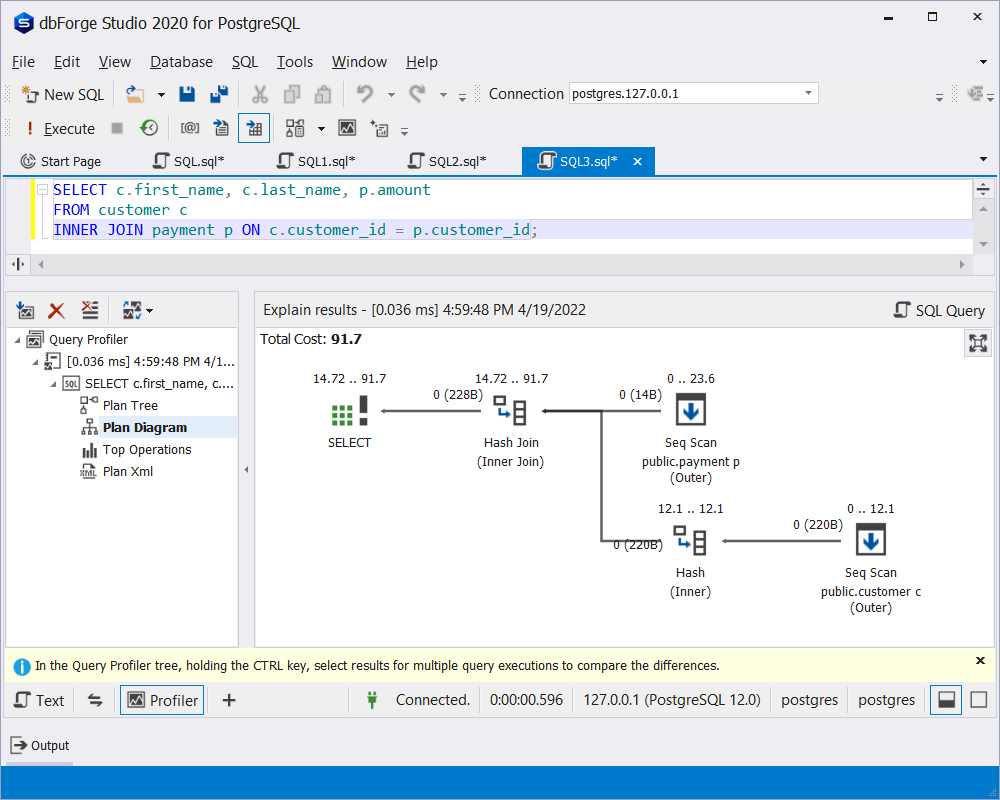
dbForge Studio for PostgreSQL comes with the top-notch query profiling tool allowing you to quickly get the PostgreSQL execution plan and query execution statistics in a visual, comprehensive format. With the Studio's Query Profiler, you can easily identify performance bottlenecks, spot slow queries, and get to the bottom of any performance issues.
The Query Profiler functionality includes:
The biggest benefit is that you don't need to go through the EXPLAIN ANALYZE output with a fine-tooth comb — query performance metrics are presented in an easily understandable way.

Having identified query performance bottlenecks, you can proceed to query optimization. However, we recommend checking the general configurations of your system including hardware and software to see if general performance tuning steps are required. In this case, your query optimization efforts will be truly effective.
Remember that there is no need to optimize all queries — only the slowest ones are worthy of your attention. When it comes to query optimization, one of the first actions to be taken is fixing indexing issues. By adding an index on a column you speed up querying that column as the index serves as a pointer to the data being sought.
Tracing query performance is of great importance for high-performance data analytics and the efficient work of data-driven applications. There is a bunch of methods for monitoring query effectiveness however, they are somewhat tedious, and the interpretation of their results requires a certain level of expertise. Instead, dbForge Studio delivers the industry-standard Query Profiling tool with advanced query performance monitoring capabilities and convenient presentation of performance indicators and metrics.