Query Profiler for PostgreSQL
Performance tuning
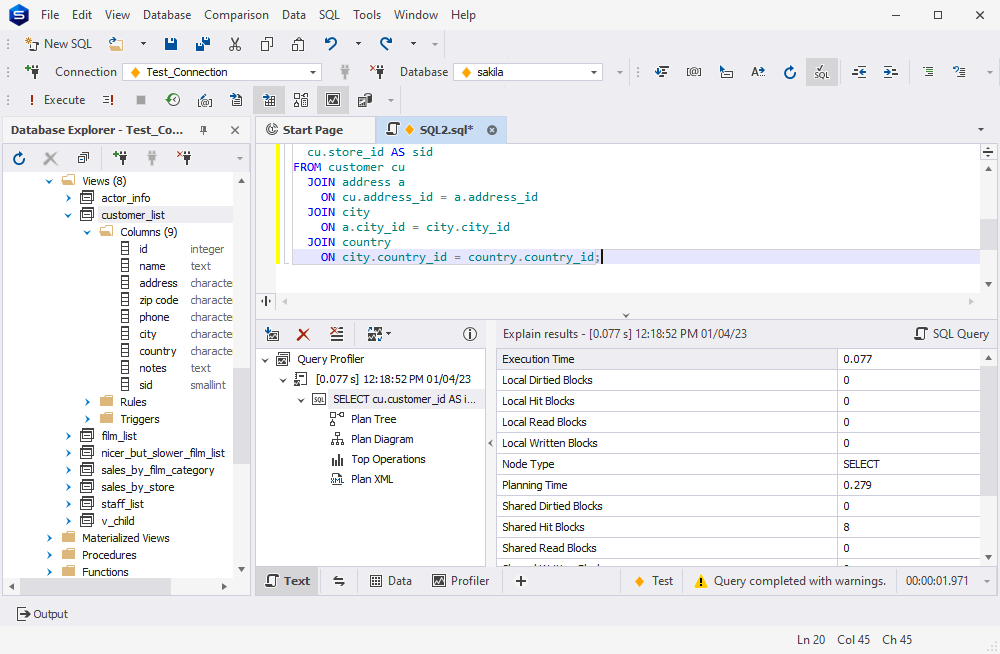
Profiling results are displayed conveniently on a separate tab of your SQL document, so you can easily navigate to your query and other tabs, if needed, without having to switch to additional windows and documents. Learn more
Query plan
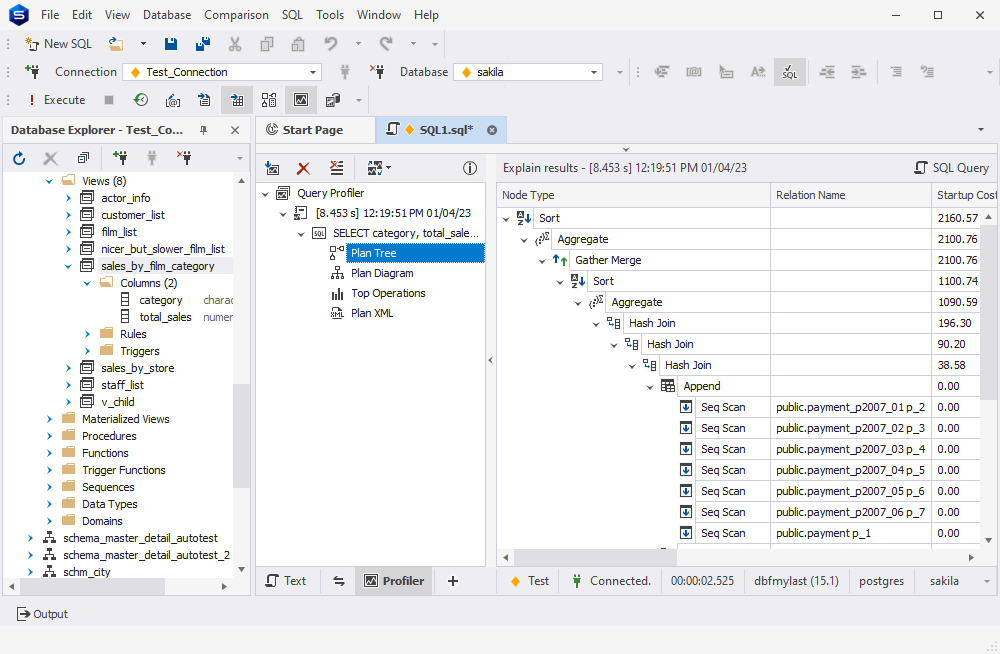
Capture query plan information in a graphical format. The tree gives a high-level overview of the execution plan hierarchy. You can use this information to improve PostgreSQL query performance or troubleshoot problems. Learn more
Query execution diagram
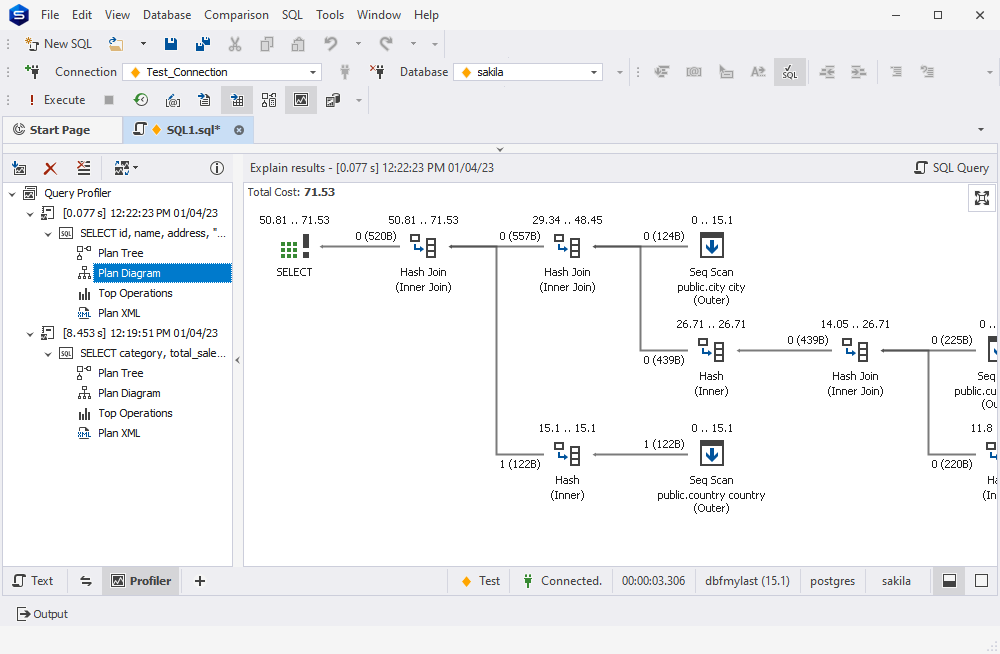
This diagram displays the cost of all operations (as a percentage of the total batch cost), the operations performed by the query, and the transferred data. For each operation, the diagram depicts relative cost, I/O cost, CPU cost, number of records, and row size. Learn more
Compare query profiling results visually
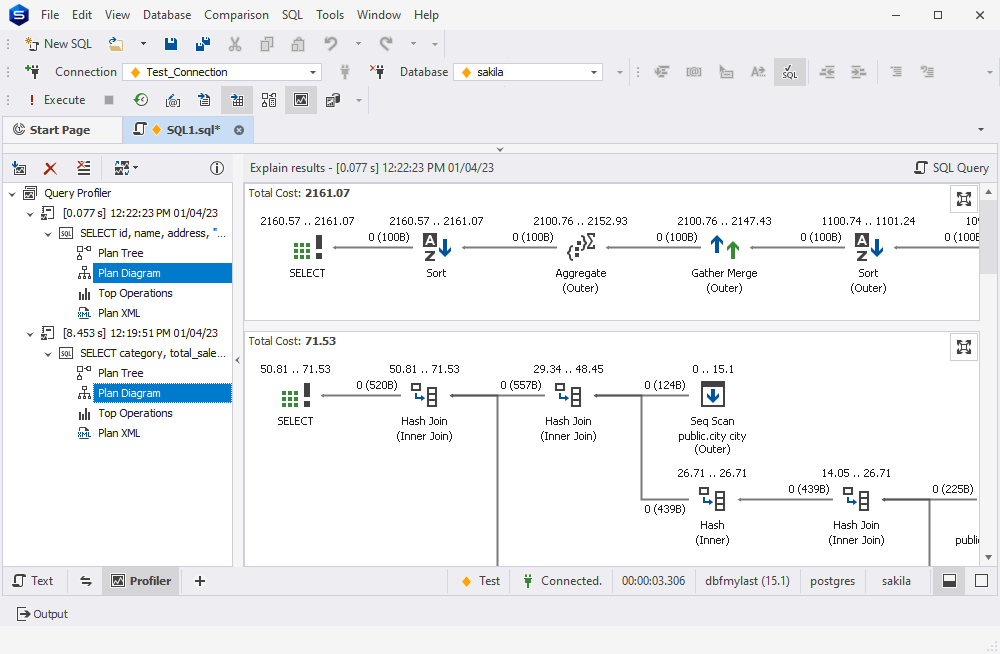
The key point in performance optimization is viewing the differences in profiling results after you change your query. Each time you get profiling results for the executed query, they appear in the tree view as a new node with the time and date of query execution. Learn more
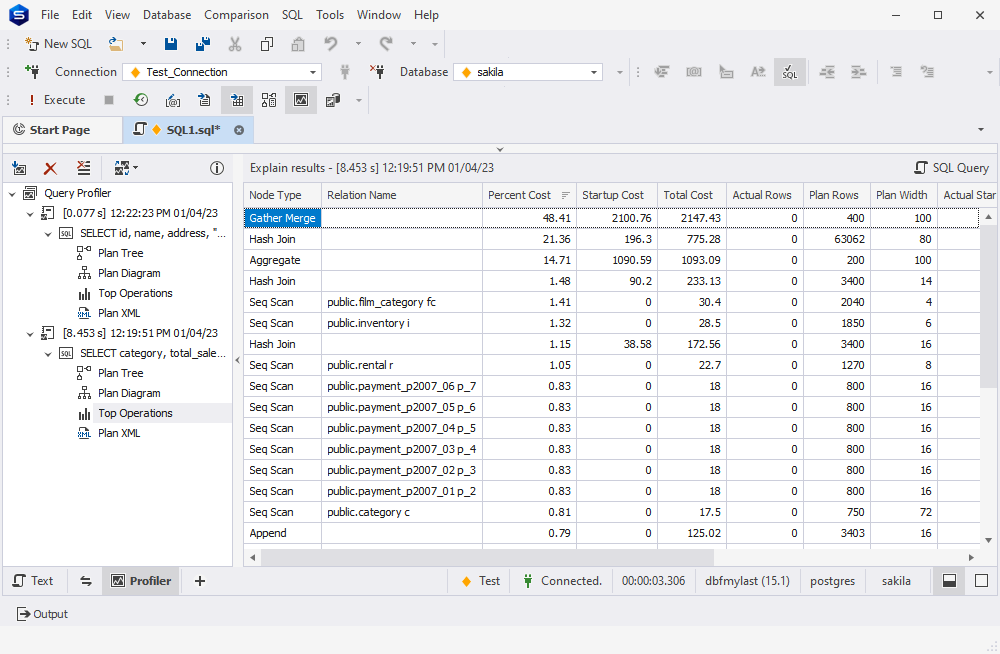
Top operations list
This is the list of the most expensive operations. View them and optimize your code accordingly. Sort the list by CPU, I/O and other costs to get a full picture for your analysis. By default, the list is ordered by the highest estimated cost. Learn more
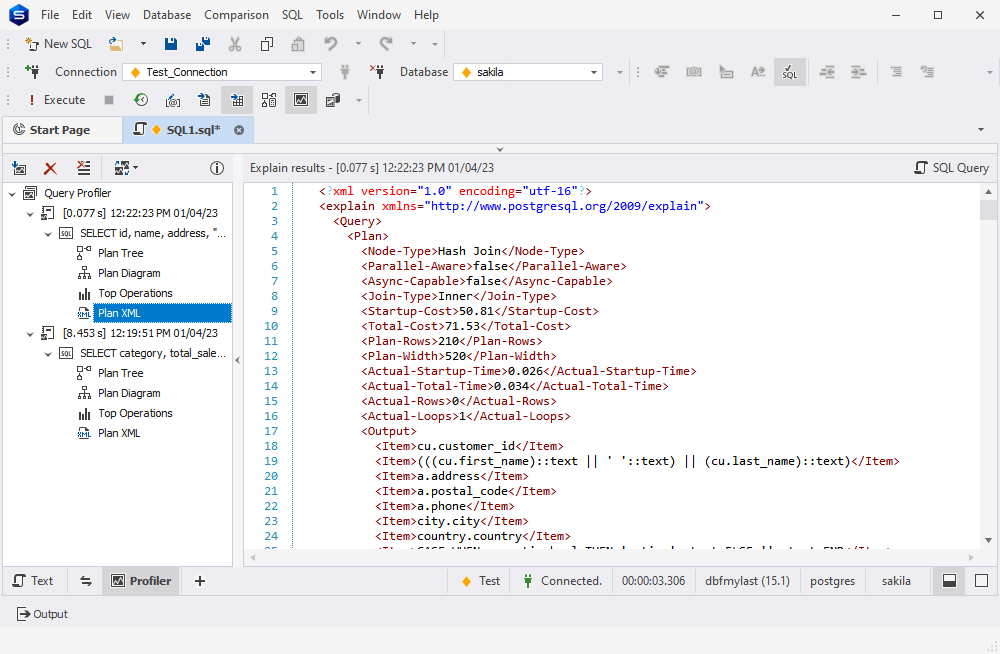
Execution plan in the XML format
Query Profiler allows to display execution plans in XML format. This can be very useful if you need to send plan details to someone in your team or if you want to save your plan and review it later. Learn more
Video Tutorial: Query Optimization Using PostgreSQL Profiler
Would you like to see how it all works in dbForge Studio?
Watch our detailed video tutorial that shows how to conduct performance tuning on
PostgreSQL queries most effectively using Query Profiler.