PostgreSQL is one of the most popular database management systems for modern applications, thanks to its reliability, flexibility, and features. However, to ensure the best performance, you need more than the default settings.
Database administrators have to identify inefficient queries, detect configuration issues, optimize resource usage, and improve the overall database responsiveness. Although PostgreSQL provides its own built-in tools, even the most experienced professionals refer to third-party specialized solutions.
In this article, we'll explore the most effective performance tuning tools for PostgreSQL, examine the features they offer, discuss their strengths and limitations, and help you choose the right tool for your environment.
Why PostgreSQL performance tuning tools matter
Performance tuning in PostgreSQL is a complex process that involves many aspects of database performance. For instance, it deals with tracking resource utilization, analyzing query execution plans, collecting runtime statistics, monitoring wait events, etc. All these factors together help you reveal the root causes of performance issues.
PostgreSQL provides built-in commands and views for gathering the necessary information, but relying solely on their raw SQL output, log files, or execution plans can be time-consuming, error-prone, and difficult to scale.
This is where specialized PostgreSQL performance tuning tools become indispensable. Query analyzers, EXPLAIN ANALYZE interpreters, profilers, log analyzers, and AI-powered optimization tools present the information via intuitive dashboards and visual execution plans, as well as provide historical metrics and intelligent recommendations. This way, they allow you to convert complex data into clear and actionable plans.
DBAs, database developers, and database engineers can refer to such tools to identify slow-running queries, missing or inefficient indexes, inaccurate row estimates, excessive disk I/O, lock contention and wait events, costly JOINs, and other factors. Therefore, they can ensure optimal performance of PostgreSQL databases.
So, let's explore the best PostgreSQL performance tuning tools available today.
PostgreSQL performance tuning tools: A comparison table
| Tool |
EXPLAIN ANALYZE support |
Visual execution plan |
AI help |
Log analysis |
Pricing |
Best for |
 dbForge Studio for PostgreSQL
|
Yes |
Yes |
Yes |
No |
Free Express edition; paid; free trial |
IDE-based tuning and development |
|
|
Yes |
Yes |
Yes |
No |
Free |
Free PostgreSQL admin and basic plan analysis |
|
|
Yes |
Yes |
No |
No |
Paid; free trial |
Guided EXPLAIN plan analysis |
|
|
Yes |
Yes |
Limited |
Yes |
Paid; free trial |
Continuous PostgreSQL monitoring |
|
|
No direct SQL editor |
No |
No |
Yes |
Free |
PostgreSQL log reports |
|
|
Yes |
Yes |
Limited |
No |
Paid; free plan |
Team SQL review and change workflows |
|
|
Yes |
Yes |
No |
No |
Free |
Free visual plan analysis |
|
|
Yes |
Yes |
No |
No |
Free |
Quick raw plan formatting |
|
|
Yes |
No |
No |
Limited |
Free |
Direct diagnostics |
Best PostgreSQL performance tuning tools list
For this article, we selected some of the most popular PostgreSQL performance tuning and query analysis tools used by database administrators, developers, and database engineers. Each tool was evaluated in practice and reviewed using the same criteria, so you can easily compare their features, pros, and cons side by side.
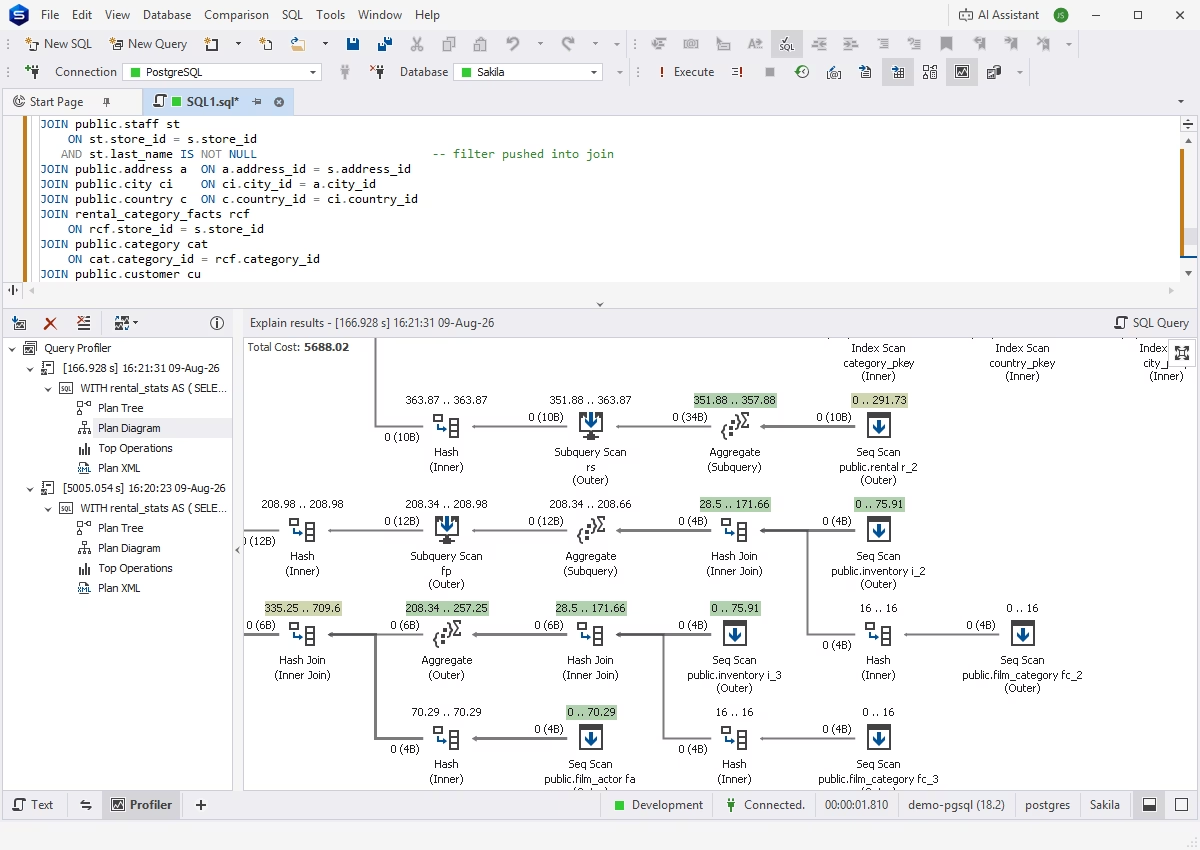
dbForge Studio for PostgreSQL is a fully featured IDE with robust features for database development, management, query profiling, execution plans, data analysis, reporting, task automation, and integrated AI assistance. One of its tools is a built-in Query Profiler that delivers robust analytical capabilities for understanding the query behavior and finding slow queries and their causes. The tool allows DBAs and database developers to visualize and analyze execution plans, compare query performance, and modify the code to optimize it directly within the Editor area.
Besides, the AI Assistant offers query analysis, troubleshooting, and optimization, and it can also generate optimized code for instant testing and comparison with the previous results. Overall, this tool is meant for DBAs, developers, engineers, and analysts who want performance tuning tools inside a broader PostgreSQL workspace.
Pros
- Built-in Visual Query Profiler
- Query analysis and optimization with AI
- Comparison of query profiling results
- Single environment for query development and performance tuning
Cons
- Limited real-time alerting compared to dedicated monitoring tools
- Desktop-based, not ideal for distributed team monitoring
Key features
- Query performance analysis
- Visualization of query execution plans
- Detailed statistics on query performance
- Support for XML format for query execution plans
- Comprehensive database management and administration
Price
- Free: Express edition (basic features)
- Paid: Subscription-based (from $89.95/year), perpetual license (from $179.95)
- Free trial: 30 days
dbForge Studio for PostgreSQL
A feature-rich and versatile IDE for database development and management, as well as data analysis and reporting
pgAdmin
pgAdmin is the only official GUI client for PostgreSQL. It is free and open-source, and officially supported by the PostgreSQL community, making it a good starting point for PostgreSQL users who prefer GUI functionality for database management and administration.
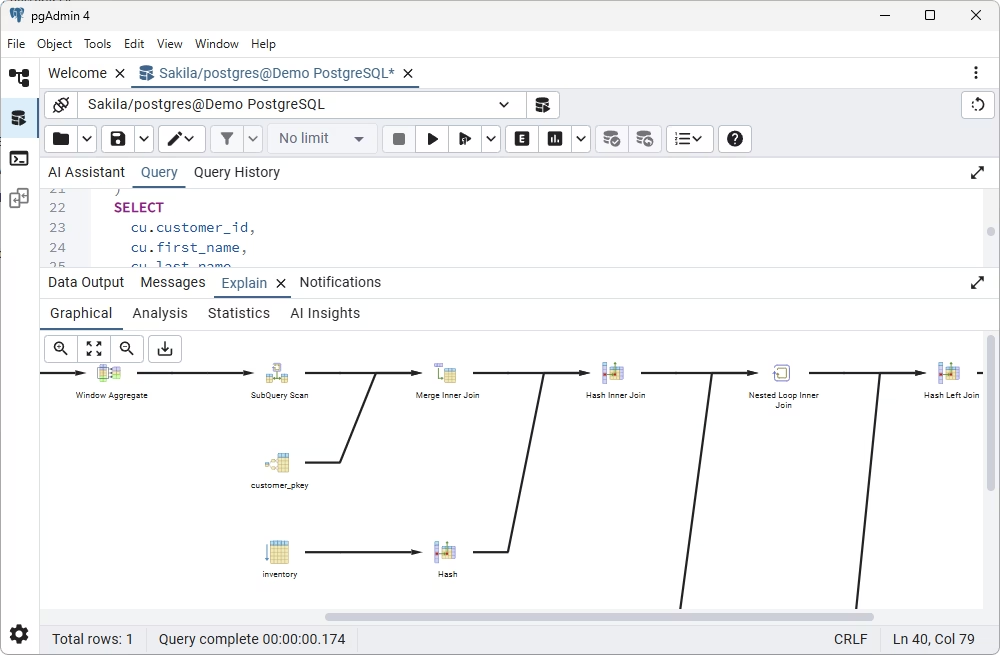
pgAdmin provides basic query profiling capabilities with a graphical EXPLAIN plan to help you construct database queries and analyze them for better performance.
Pros
- AI assistance for query analysis
- Shortcuts in the EXPLAIN tree-view
- Support for JSON format in EXPLAIN
Cons
- Lack of profiling results comparison
- AI help requires separate configuration
Key features
- Graphical EXPLAIN plan showing costs, row estimates, and timing per node
- Dedicated Query Tool with integrated AI assistance (third-party AI providers)
- Graphical, text, and statistics tab formats in the EXPLAIN output
- General database administration functionality
Price
pgMustard
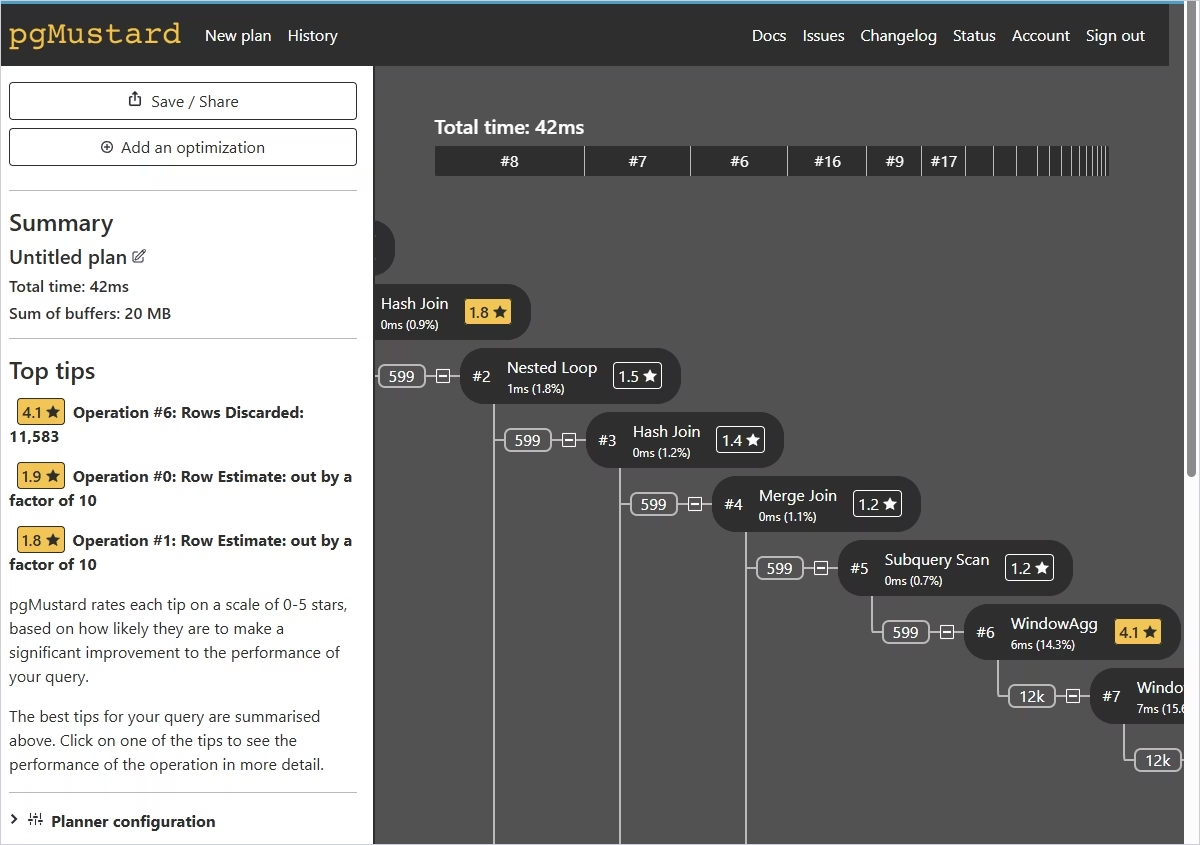
pgMustard is a commercial tool designed for visualizing and analyzing PostgreSQL queries. The primary purpose of this tool is to help users interpret the EXPLAIN ANALYZE output correctly and thus optimize query performance.
pgMustard provides comparison notes for the visualized plans and adds recommendations for fixing performance issues. This tool allows users to better understand and apply query tuning recommendations with no need for in-depth SQL and database administration expertise.
Pros
- EXPLAIN ANALYZE output as a to-do list
- Smart results presentation with the focus on problematic fragments
- Scores and tips for detected issues in plain language
Cons
- Commercial solution with a high price
- Lack of performance monitoring
- Requires practical execution of the query
Key features
- Tree-like visualization of the EXPLAIN and EXPLAIN ANALYZE plans
- Support for TXT and JSON formats for the EXPLAIN plans
- In-depth analysis of the issues that slow down performance
- API access in addition to the web interface
- Additional materials for the explanation of detected issues
Price
- Paid: Subscription-based (from $110/year)
- Free trial: No time limits, restricted in functionality
pganalyze
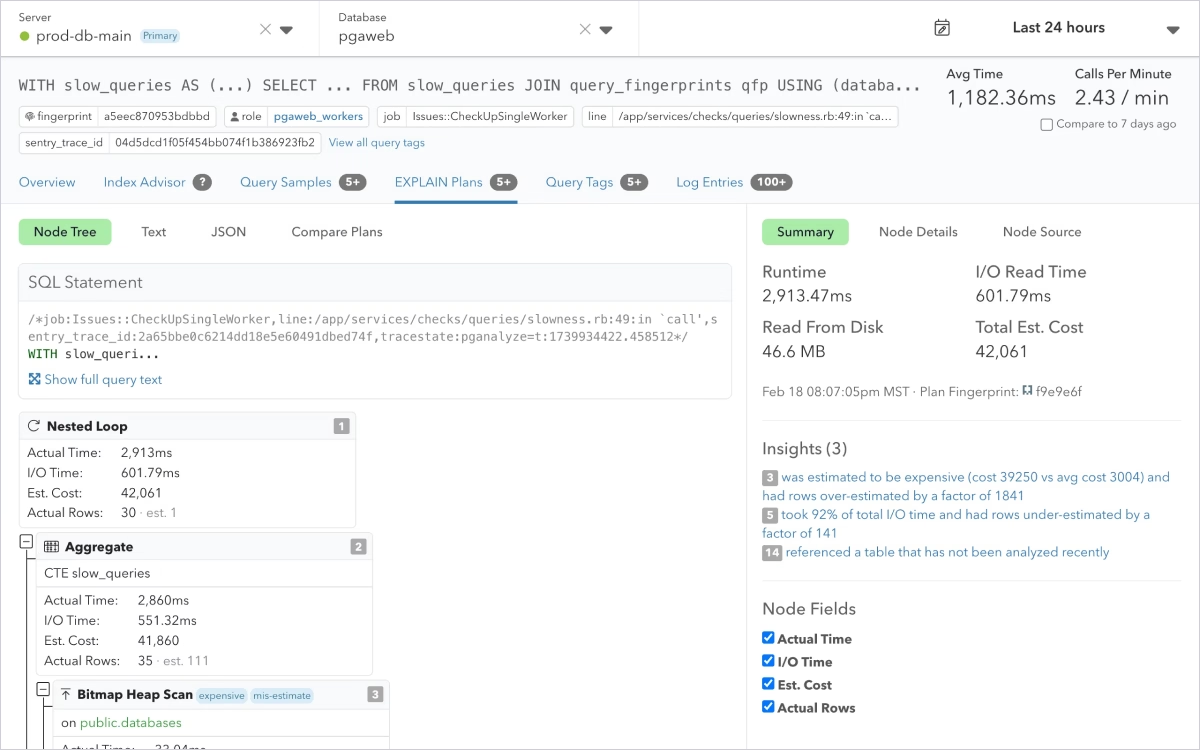
pganalyze is a performance monitoring and tuning tool designed for PostgreSQL and covering indexing, VACUUM, configuration, and query plans analysis. It collects PostgreSQL statistics, system metrics, and logs. Then it analyzes the collected data and visualizes it to help you detect slow queries, optimize indexes and query plans, and track performance trends over time. Though it is not a comprehensive database management IDE, it delivers the functionality required by database administrators to keep their databases fast and stable.
Pros
- Support for popular cloud-managed services
- Continuous real-time monitoring
- Automated index analysis and recommendations
- Collecting and keeping historic statistics
- Built-in PII filtering
Cons
- Commercial product; high price
- Requires installing an agent
- Complex configuration
Key features
- Real-time performance monitoring
- Query plans with auto_explain
- Query Advisor (detecting and fixing query plan issues)
- Index Advisor
- VACUUM Advisor
- Single sign-on (SSO) and role-based access control
- Log Insights with event filters
- Workbooks (dedicated environment for query optimization)
- Alerts
Price
- Paid: Subscription-based (from $149/month)
- Free trial: 14 days
pgBadger
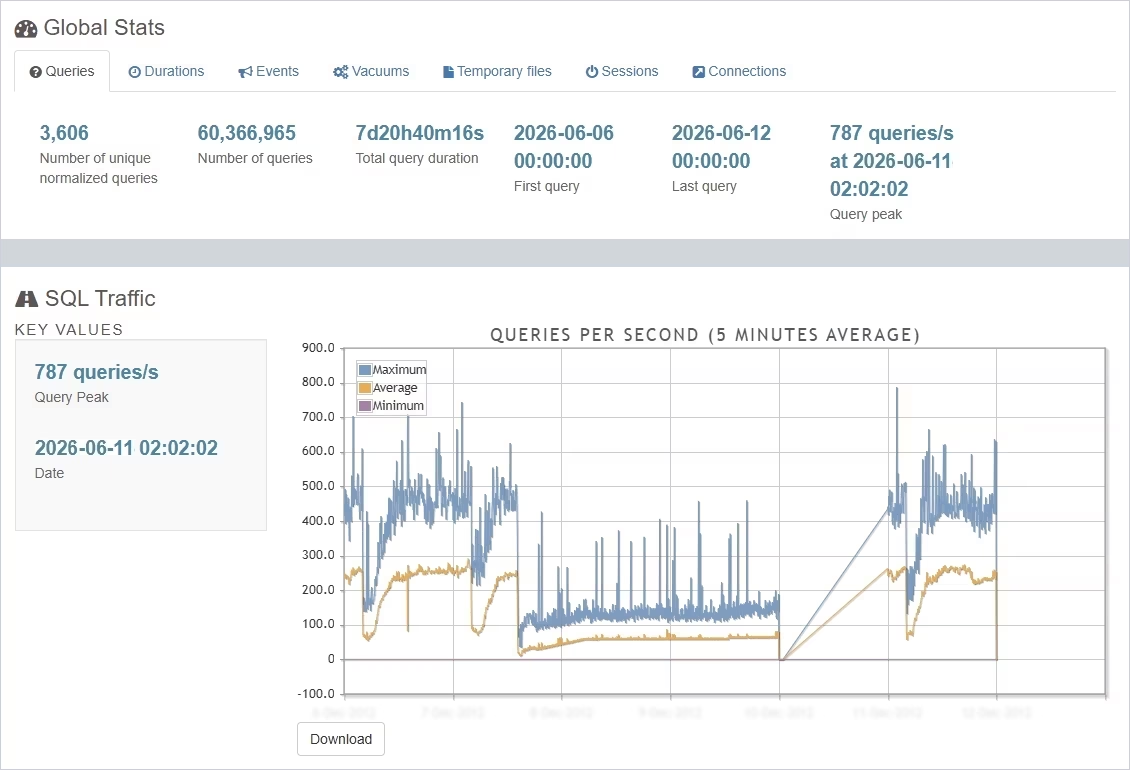
pgBadger is a free open-source log analyzer for PostgreSQL that delivers smart, detailed reports based on log files. The solution can parse large log files and compressed files in various formats and generate well-designed HTML graphical reports that can also be saved as PNG images.
Pros
- Parallel processing of multiple files
- A single solution with no need for additional libraries
- Excellent processing of large files
Cons
- No real-time performance analysis
- No query plan analysis
- No recommendations on improving queries
Key features
- Detailed reports on query statistics, including slow queries, query types, queries per user/database/application, etc.
- Checkpoint statistics, autovacuum/autoanalyze statistics, lock statistics, etc.
- Reports on the most frequent errors
- Running against archived logs without live access to the system
- Configuring reports on duration and number of queries only
Price
Bytebase
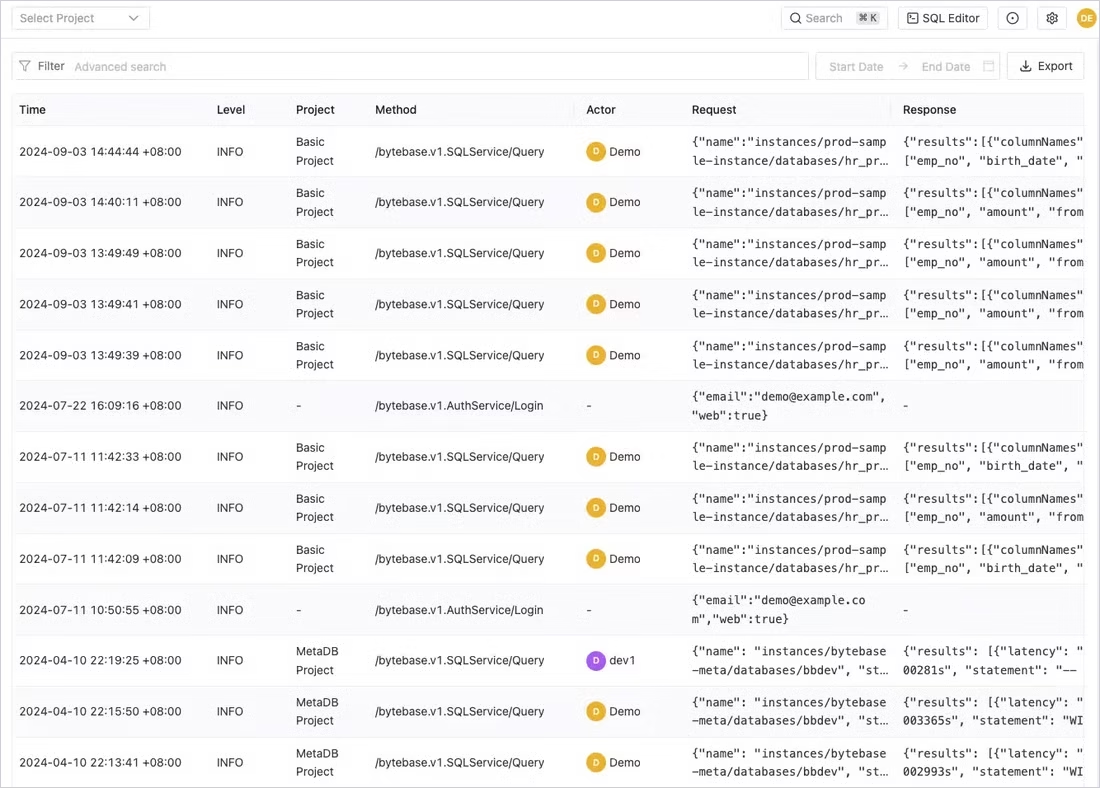
Bytebase is a database governance platform for teams and AI agents that allows them to access, modify, and audit databases across all major database types and environments, including PostgreSQL. It is designed for tasks like schema management, access control, and so on, and includes a set of powerful features for performance analysis with monitoring and query profiling.
Pros
- Self-hostable platform (single Docker image)
- Performance checks and change management
- Performance issue detection with SQL Review rules
- Support for diverse databases
Cons
- Limited performance tuning options
- Index Advisor depends on the OpenAI API
- Advanced governance features are in the Enterprise edition only
Key features
- Configuration change tracking within the Bytebase workspace
- Detection of slow queries via PostgreSQL's pg_stat_statements
- AI-powered Index Advisor with slow query analysis
- SQL Review policies—automated checks on SQL and schema changes integrated with CI/CD pipelines
- Query history
Price
- Free: Community plan (limited users)
- Paid: Subscription-based (from $20/month per user)
- Free trial: 14 days
Explain Dalibo (PEV2)
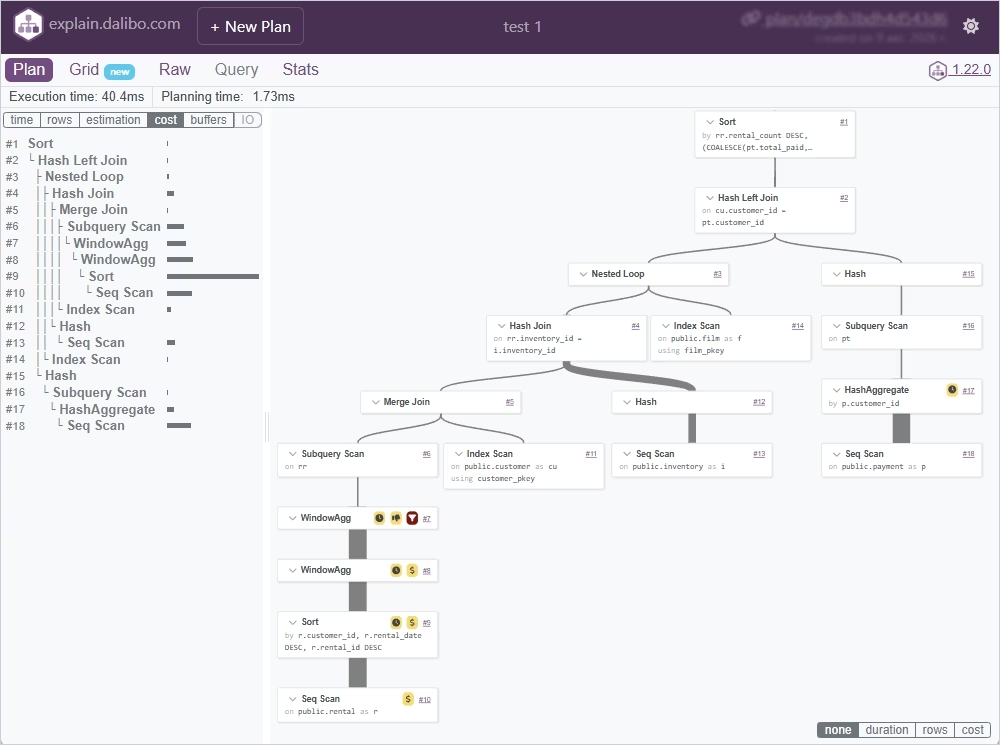
Explain Dalibo (PEV2) is a free, open-source, web-based EXPLAIN plan visualizer that is accessible at its official page and also embeddable. Users can paste their query EXPLAIN plans in JSON or TXT formats into the workspace and get the visual representation of the plan, which is very helpful for reviewing complex plan trees.
Pros
- Support for JSON and TEXT formats
- Flexible integration options for embedding
- psql support (uses plan-exporter)
- Actively maintained product
Cons
- Limited guidance on detected issues
- Storing plans server-side by default (may not be suitable for sensitive queries)
Key features
- Creation of interactive graphical plan trees
- Visualization of per-node statistics
- Sharing of execution plans via links
- Highlighting of problem areas in the plan
- Working in online and offline modes
Price
Depesz EXPLAIN visualizer
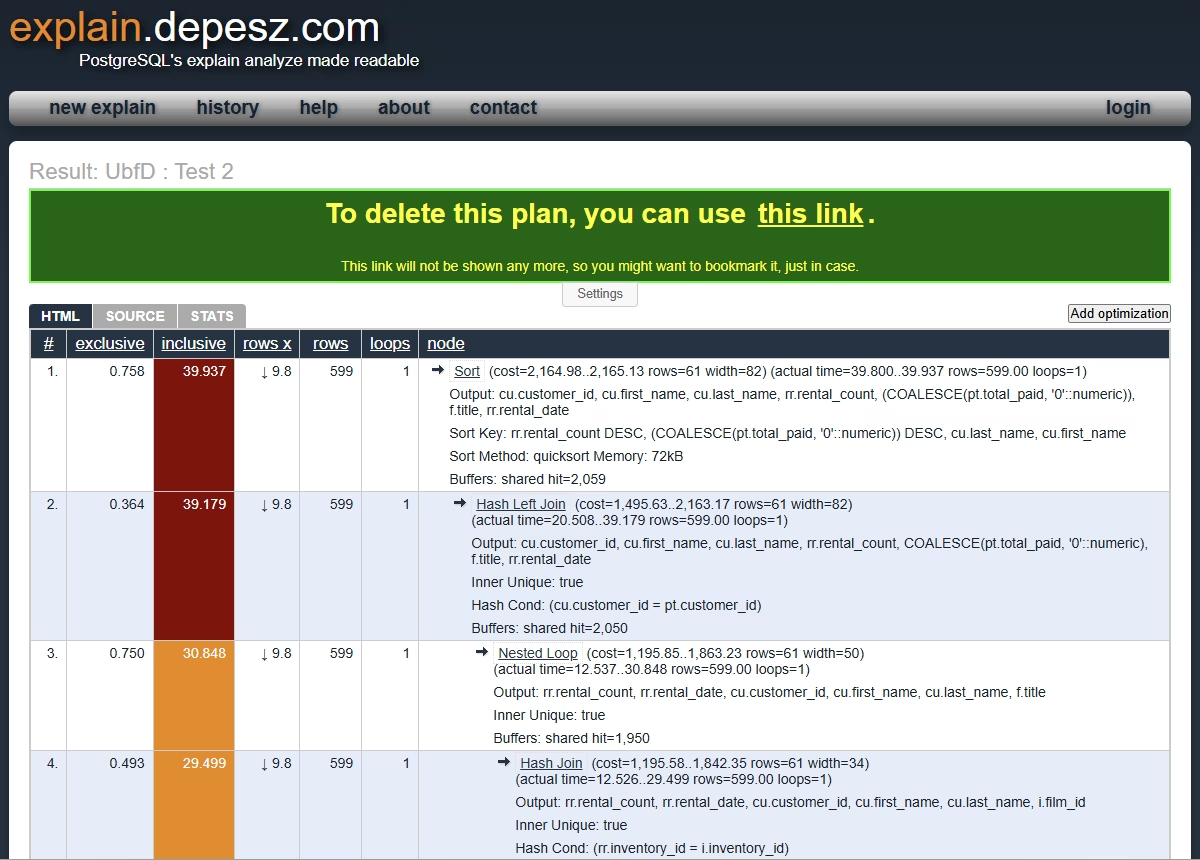
Depesz is a free and open-source solution and one of the most popular tools for visualization of complex EXPLAIN ANALYZE outputs in PostgreSQL, especially for complicated production queries with many JOINs and subqueries. It requires pasting a text or JSON plan into the visualizer area and automatically converts its structure into a tree format with helpful performance hints for each node.
Pros
- Color-highlighting of problematic nodes by time spent
- Multiple format support (TEXT/JSON/YAML/XML)
- Saved history of past plans
- Web-based tool
Cons
- Somewhat outdated UI
- Limited hints
- Storing submitted plans server-side by default
Key features
- Detection of the most expensive elements on the node level
- Comparison of actual vs estimated rows
- Comparison of costs vs actual timing
- Possibility to collapse subplans for large plans
- Self-hostable solution via Perl/Mojolicious
- Shareable history of entered plan for comparison
Price
Native PostgreSQL tools: EXPLAIN, auto_explain, and pg_stat_statements
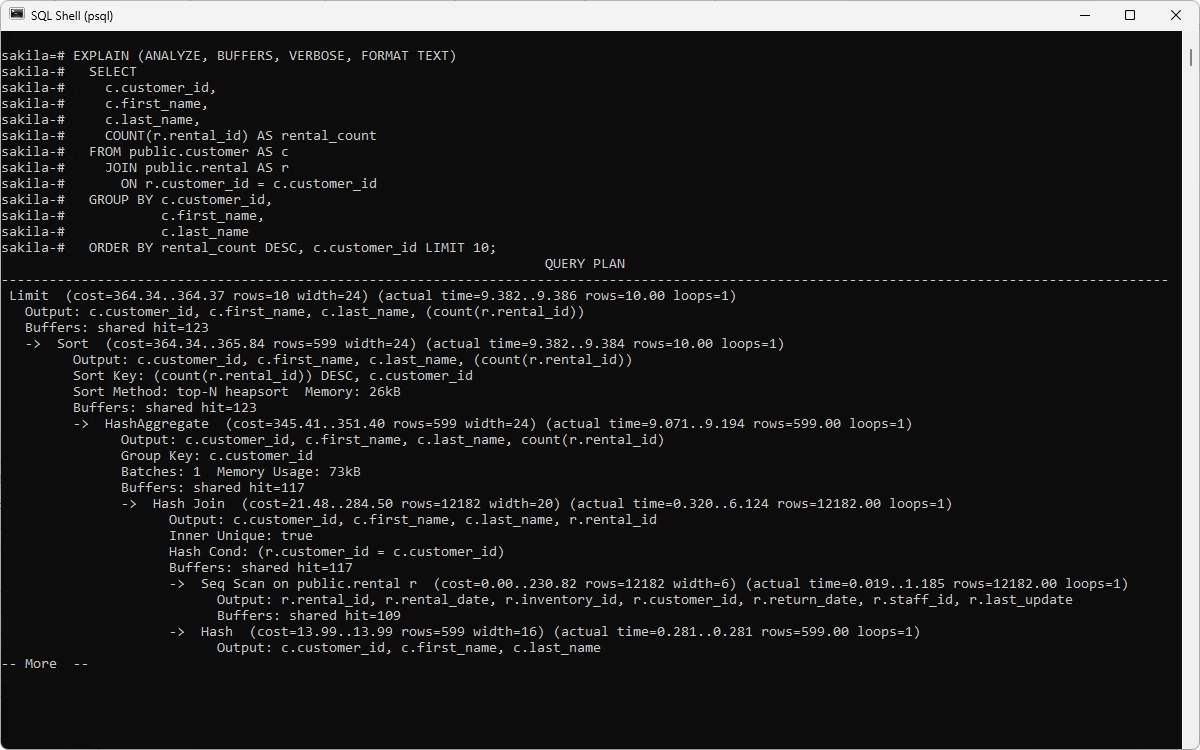
Native PostgreSQL performance tuning tools are built-in commands, views, and optional extensions that provide the necessary information on query performance without the need for any third-party solutions. They allow PostgreSQL specialists to efficiently detect problematic areas and fix them.
Pros
- No additional cost or involvement of third-party tools
- Full compatibility with PostgreSQL on-premises or in the cloud
- Original source of truth and foundation of all performance tuning tools
- Scripting, scheduling, and integration with custom dashboards
Cons
- No built-in visualization or recommendations in plain language
- No built-in history keeping
- Often require in-depth SQL knowledge
Key features
- EXPLAIN / EXPLAIN ANALYZE—the fundamental commands for query plan inspection. EXPLAIN shows the planner's strategy, EXPLAIN ANALYZE adds runtime data.
- BUFFERS—an additional option used in EXPLAIN ANALYZE for bringing I/O information.
- auto_explain—an extension that logs execution plans automatically.
- pg_stat_statements—an extension that aggregates normalized query statistics (calls, total/mean time, rows, shared/local block hits, temp block usage, I/O timing) across the server.
- pg_stat_activity—a view that delivers real-time information about the backend processes, including the current query text, state, wait events, and duration.
Price
How to choose the best PostgreSQL performance tuning tool
We have reviewed diverse performance tuning tools designed for PostgreSQL, and as you can see, they differ considerably in both functionality and approach. Some are full-featured IDEs, while others are lightweight web-based tools focused solely on visualizing and interpreting EXPLAIN plans. So, which one should you choose?
The first step is to define what you expect the tool to do. While it may be tempting to choose the most feature-rich solution, it may not be the most practical or cost-effective option if you don't need all its capabilities. Instead, consider your day-to-day workflow. Do you occasionally analyze individual queries, or do you regularly develop, optimize, and troubleshoot SQL code? Do you manage a single PostgreSQL database or multiple databases across on-premises and cloud environments? Do you need a solution that supports the entire database lifecycle, with performance tuning as one of its required capabilities?
Answering these questions will help you narrow down the available options.
Choose an IDE if you tune queries during development
If you optimize queries as part of your daily workflow, an IDE is often the most practical choice. Such solutions provide the toolsets covering the full SQL development process where you write the code, inspect the query execution plan, optimize it, and adjust the code without switching between multiple applications.
dbForge Studio for PostgreSQL is the most powerful PostgreSQL IDE, providing an integrated environment for database development and administration. You can execute queries, view query plans, manage database objects, and monitor server activity from a single workspace. pgAdmin is another DBAs' favorite that allows them to refine code, create indexes, modify schemas, and immediately verify changes.
Choose a visualizer if you only need to read EXPLAIN ANALYZE
If you already have the output of an EXPLAIN/EXPLAIN ANALYZE statement and simply need help interpreting it, you may choose a dedicated execution plan visualizer.
Tools such as pgMustard, Dalibo, and Depesz convert PostgreSQL execution plans into smart, interactive visualizations. They let you quickly identify expensive JOINs, inaccurate row estimates, missing indexes, and other problematic issues without spending time and effort on manually interpreting large text-based plans.
Choose log analysis and monitoring if you need historical performance data
In most cases, it is not enough to analyze a single execution plan. Database administrators need to detect recurring performance problems, monitor workload trends, and catch issues before they affect users.
You can benefit from using such tools as pganalyze or pgBadger that collect and analyze PostgreSQL logs and performance statistics over time. These tools focus on problems like review checkpoints, autovacuum activity, temporary file usage, and lock contention to help you understand overall server behavior.
Choose native PostgreSQL tools if you need direct control
The information delivered by the PostgreSQL's built-in diagnostic tools remains indispensable. Core tools like EXPLAIN/EXPLAIN ANALYZE, especially with the BUFFERS option, auto_explain, and pg_stat_statements provide raw performance data for the third-party applications that collect, visualize, and analyze the information for performance tuning.
Even if you continuously use modern GUI tools, you need these native tools because they give you greater control over performance analysis and help you validate the recommendations provided by the third-party solutions.
Which PostgreSQL performance tool should you use?
PostgreSQL performance tuning tools vary widely in both functionality and scope. Some provide comprehensive environments for database development, administration, and performance optimization, while others focus on a single task, such as visualizing execution plans or analyzing log files. As a result, you can choose a solution that best matches your workflow and requirements.
If you need an all-in-one PostgreSQL IDE with query profiling, execution plan analysis, SQL development features, and AI-assisted query optimization, dbForge Studio for PostgreSQL is a decent option. If you prefer PostgreSQL's standard graphical administration tool, pgAdmin offers built-in support for query execution and a visual EXPLAIN plan for everyday database administration. For users who primarily need to interpret execution plans, pgMustard and Explain Dalibo provide clear visualizations. pganalyze is a popular platform for production monitoring and performance analysis, while pgBadger specializes in analyzing PostgreSQL log files and generating detailed performance reports. Finally, PostgreSQL's native features—including EXPLAIN, EXPLAIN ANALYZE, pg_stat_statements, and auto_explain—remain the foundation of performance tuning and power many third-party solutions.
Meanwhile, you can test and evaluate dbForge Studio for PostgreSQL in your workflow—download the fully functional free trial and see how it helps you overcome your daily challenges.
FAQ
What are PostgreSQL performance tuning tools?
PostgreSQL performance tuning tools are dedicated solutions that help monitor database activity, analyze query execution, identify bottlenecks, and optimize overall performance. They include built-in utilities such as EXPLAIN, EXPLAIN ANALYZE, pg_stat_statements, and auto_explain, as well as third-party solutions like dbForge Studio for PostgreSQL, pganalyze, pgBadger, pgMustard, Depesz, and more.
What is the best PostgreSQL performance tuning tool?
The choice of the best solution depends on your needs and requirements. IDEs such as dbForge Studio for PostgreSQL or pgAdmin are well suited for query development and optimization, visualizers like pgMustard and Explain Dalibo simplify execution plan analysis, while monitoring platforms such as pganalyze provide all-around production performance monitoring.
How do I analyze PostgreSQL query performance?
Start by running EXPLAIN ANALYZE to view the query execution plan and actual execution statistics. Compare estimated and actual row counts and identify expensive operations. Then you can modify those queries to achieve the goals with less expensive means. AI assistance is helpful in this task. For instance, you can use the integrated AI Assistant in dbForge Studio for PostgreSQL, as it offers query analysis, troubleshooting, and optimization. It can also rewrite the query for you to test it immediately with Query Profiler.
What is EXPLAIN ANALYZE in PostgreSQL?
EXPLAIN ANALYZE is a command that delivers the full information related to the query execution, displaying its actual execution plan together with runtime statistics. Unlike EXPLAIN, it measures the real execution time, row counts, and execution costs of each operation. This way, EXPLAIN ANALYZE becomes one of the most valuable tools for diagnosing query performance problems.
What is the difference between EXPLAIN and EXPLAIN ANALYZE?
EXPLAIN shows the expected execution plan without running the query. EXPLAIN ANALYZE actually executes the query and reports the real execution plan, execution time, row counts, and other runtime statistics. As a result, EXPLAIN ANALYZE provides much more accurate and reliable information for performance tuning.
How do I read EXPLAIN ANALYZE output in PostgreSQL?
Read the execution plan from the bottom up, following how PostgreSQL retrieves and processes data. Pay close attention to node types, estimated versus actual row counts, execution times, loop counts, and expensive operations such as sequential scans or nested loops. If your execution plan is very large, you may use dedicated visualizers like Explain Dalibo or Depesz that convert the text information into visual diagrams that are much more accessible.
What does BUFFERS mean in PostgreSQL EXPLAIN ANALYZE?
The BUFFERS option adds information about shared, local, and temporary buffer usage during query execution. It shows whether data was read from memory or disk, helping you identify high I/O activity, inefficient caching, and queries that cause excessive disk reads or writes.
What is the best PostgreSQL query analyzer?
The best PostgreSQL query analyzer is the tool that meets your needs precisely. dbForge Studio is a popular choice for query analysis during development, pgMustard is a convenient interpreter of the EXPLAIN ANALYZE output, pganalyze provides advanced production monitoring and query analysis, and pgBadger is an excellent option for analyzing PostgreSQL log files.
Are there free PostgreSQL performance tuning tools?
Yes. First, PostgreSQL includes its own built-in tools such as EXPLAIN, EXPLAIN ANALYZE, pg_stat_statements, and auto_explain. Also, free third-party tools include pgAdmin, pgBadger, Explain Dalibo (PEV2), and Depesz.
Should I use pg_stat_statements for PostgreSQL tuning?
Yes. pg_stat_statements is one of the most valuable extensions for PostgreSQL performance tuning. It collects execution statistics for SQL statements, helping you identify the most time- and resource-consuming queries. It is particularly useful when you need to find recurring performance issues.
Can dbForge Studio for PostgreSQL profile queries?
Yes. The Studio includes a visual PostgreSQL Query Profiler. It displays the execution plan as a Plan Tree and a visual diagram with comprehensive statistics. It also collects and delivers the details on each operation's cost as a percentage of the total batch cost. You can also review the list of the most resource-intensive operations, view the execution plan in XML format, and save or share it for further analysis. After optimizing a query in the integrated SQL Editor, you can run it again and compare the new execution plan with the previous one. Each profiling session is saved as a separate node with the execution date and time.
Does dbForge Studio for PostgreSQL support AI query optimization?
Yes. The integrated AI Assistant can analyze SQL queries, identify potential issues, recommend optimizations, and rewrite queries to improve their performance and readability. Since the AI Assistant is fully integrated into dbForge Studio for PostgreSQL, you can optimize a query, compare the updated execution plan with previous profiling results using Query Profiler, verify the performance improvements, and execute the optimized query—all within a single IDE.