Pivot Table
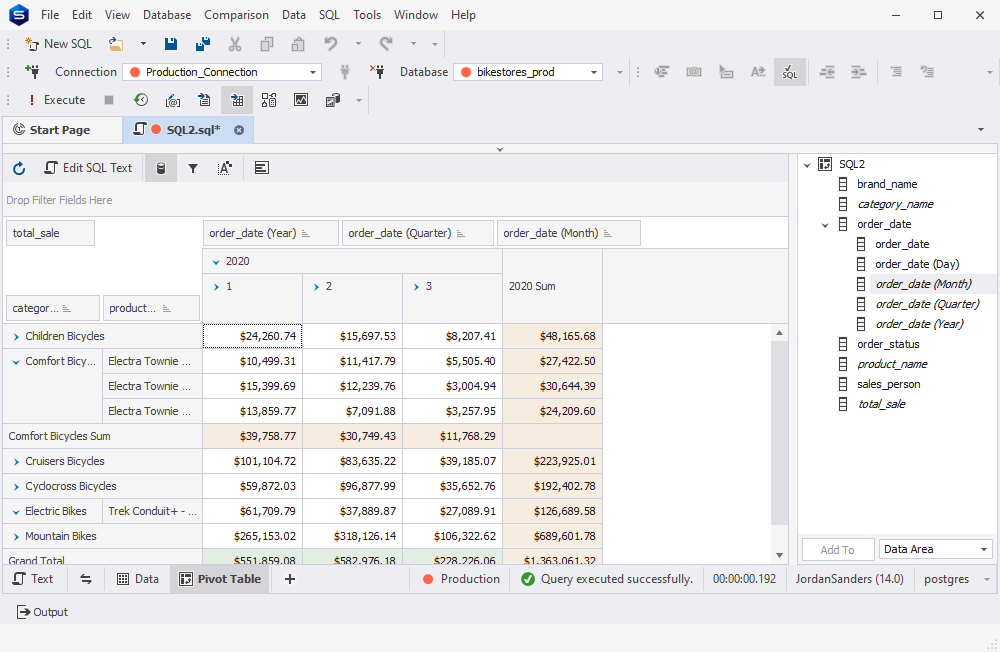
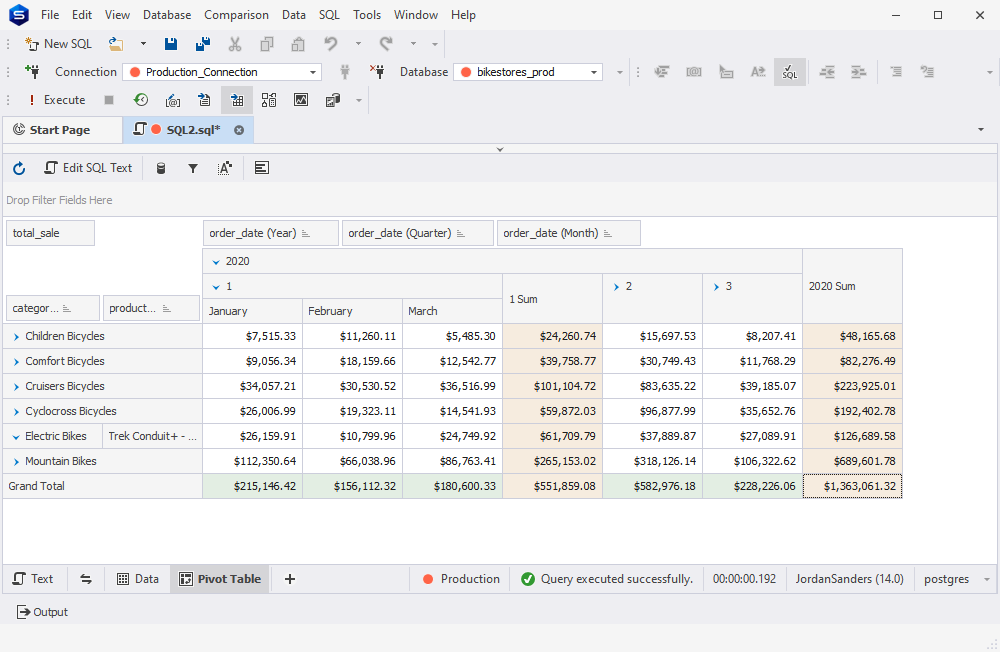
Creating a Pivot Table
Within dbForge Studio for PostgreSQL, you obtain
the top-notch functionality that allows reorganizing your data via creating a pivot table. The Pivot Table option
enables you to transform columns into rows as well as rows into columns. It also empowers you to summarize, count,
group, total, or average your data.
To transform the representation of your data, you first need to run a query in which you specify the data for analysis. Next,
you should navigate to the output of the query. Right-clicking the data grid, you will see a drop-down list where you go to Send to
and then click the Pivot table option. If you intend to add more fields to the table, you just need to drag them from the Data Source view.
View details
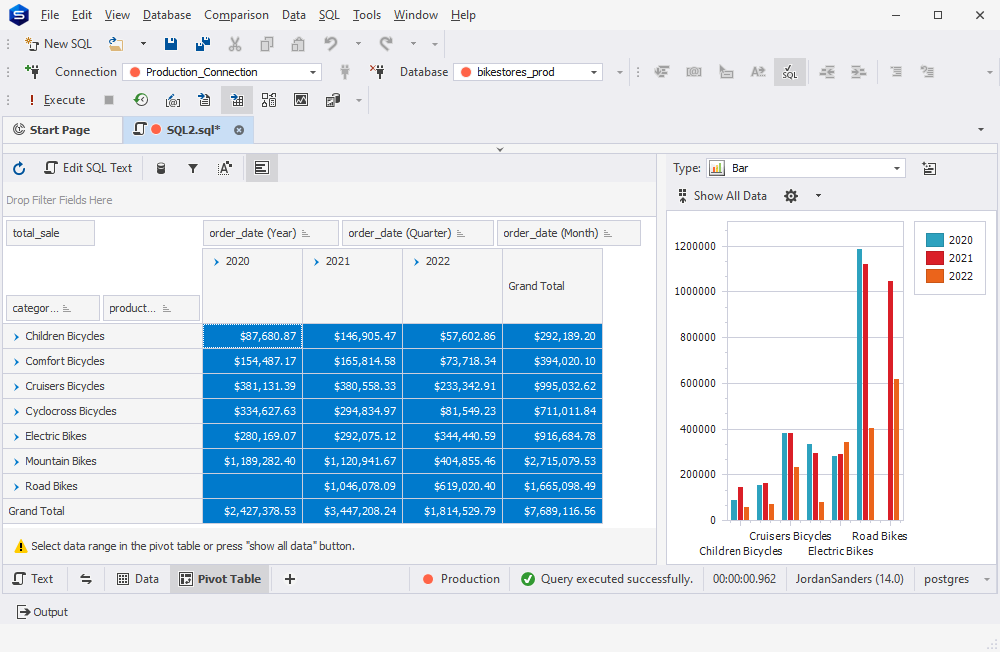
Creating a Chart
A great way to visualize your pivot data and thus to boost its informativeness and clarity is to create a chart.
This option is available in Studio for PostgreSQL, and you can easily enable it by clicking the Show Chart
button on the pivot table document toolbar. Viewing your data as a chart will help you visualize data dependencies
as well as compare them.
View details
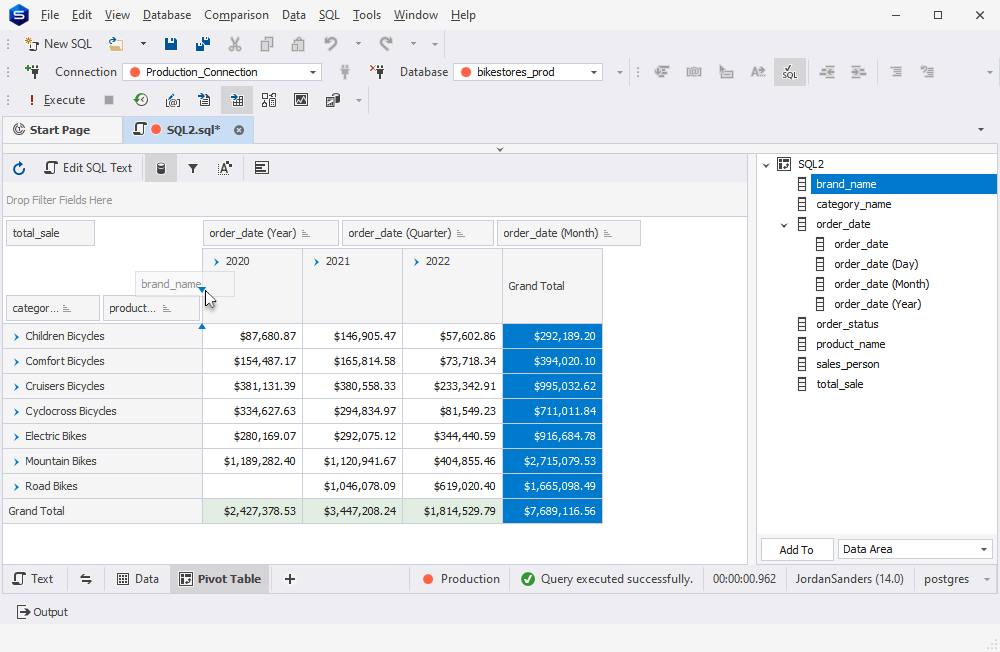
Reordering Fields
If you find yourself struggling to read or analyze data details in a pivot table, you can
easily change the layout and arrange your data in a different way. All you have to do is
to drag a field from one area of a pivot table to design its layout and change the
data form.
View details
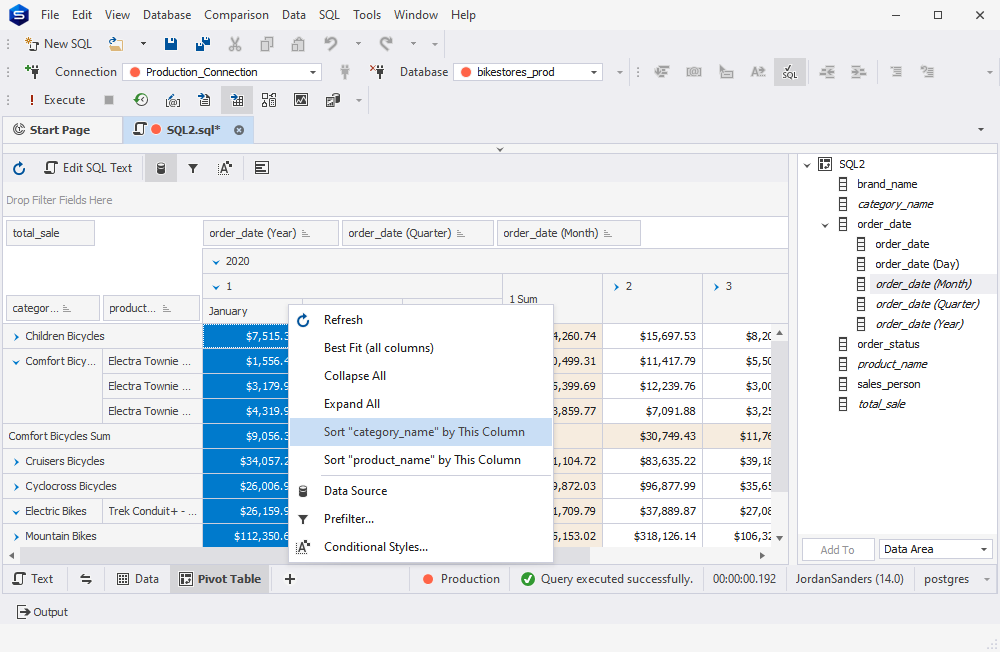
Sorting and grouping fields
To push the boundaries further, dbForge Studio offers you the possibility to choose how you like your data
to be sorted and grouped to have a clearer picture of data relationships and patterns.
Sorting implies that you can set the order of displaying data to ascending or descending,
whereas grouping data involves applying predefined group modes.
View details
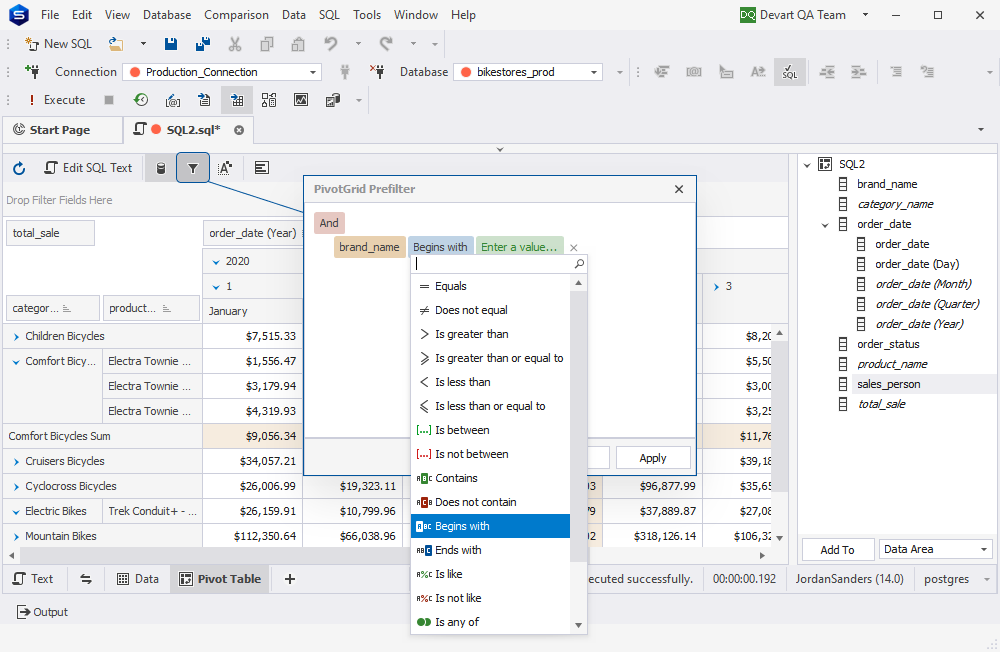
Filtering fields
You can benefit from a number of filters, with the help of which you are free to decide which
data you would like to display in your pivot table. By clicking the Filter button on the field
header, you can select which values are to be displayed, and your data will be filtered based on
the chosen parameters. You can also make the most of the tool and filter all data
in your pivot table if you simply drag a required field from the Data Source view to the
Filter
area.
View details
Using Summary Functions to Calculate Custom Totals
Using dbForge Studio for PostgreSQL, you can gain from various summary functions
that you can apply to particular column or row fields so as to calculate custom totals
for their values. One more essential benefit is that just as you add row or column fields
to a pivot table, the sum values are calculated by default.
View details