Using an effective monitoring tool is important not only for maintaining databases and analyzing overall performance but also for
preventing costly system failure or delays. dbForge Studio for SQL Server offers
a powerful SQL Server performance analysis and diagnostic tool - Monitor. The SQL Diagnostic Manager feature visualizes data affecting the performance as an overview on the dashboard and in detail on tabs.
It displays performance information in real time as well as collects detailed performance metrics by saving its data to log files.
The metrics include but are not limited to total CPU and memory utilization, disk activity, write and IO latency, data input and output,
wait and session statistics, full and range scans, page reads and writes, page faults, waiting tasks, deadlocks, query execution plan and diagram, and much more.
Monitor real-time server performance
Control and tune SQL Server performance
Be aware of possible performance issues
Measure database size to evaluate space and resource allocation for future use
Dig deeper into reasons that lead to poor performance
Detect bottlenecks that impact your application
Identify queries that take up the most resources
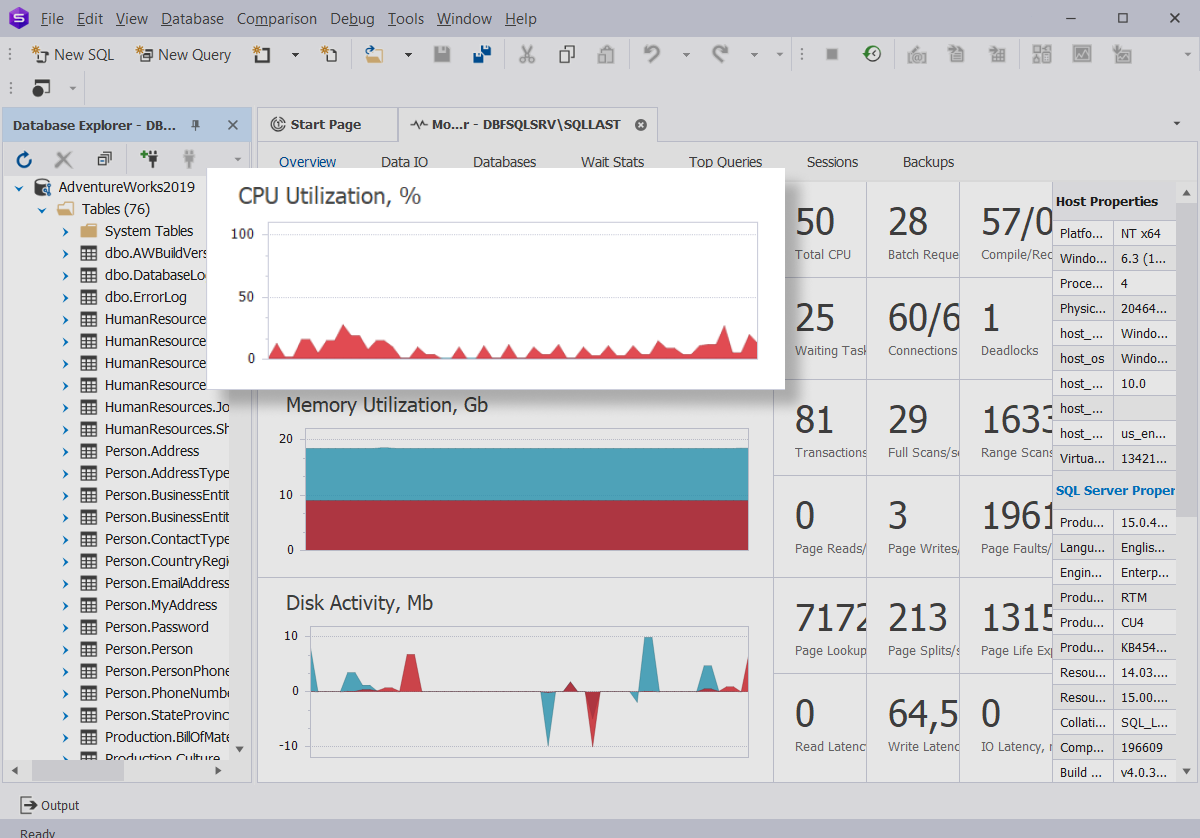
CPU Utilization
The SQL Diagnostic Manager solution with its metrics allows you to assess how much CPU resources SQL Server consumes and ensure that the application performs at an optimal level. In addition,
it will help you detect the reasons for poor performance. To analyze the behavior,
simply have a look at the graph and values on the Global Dashboard.
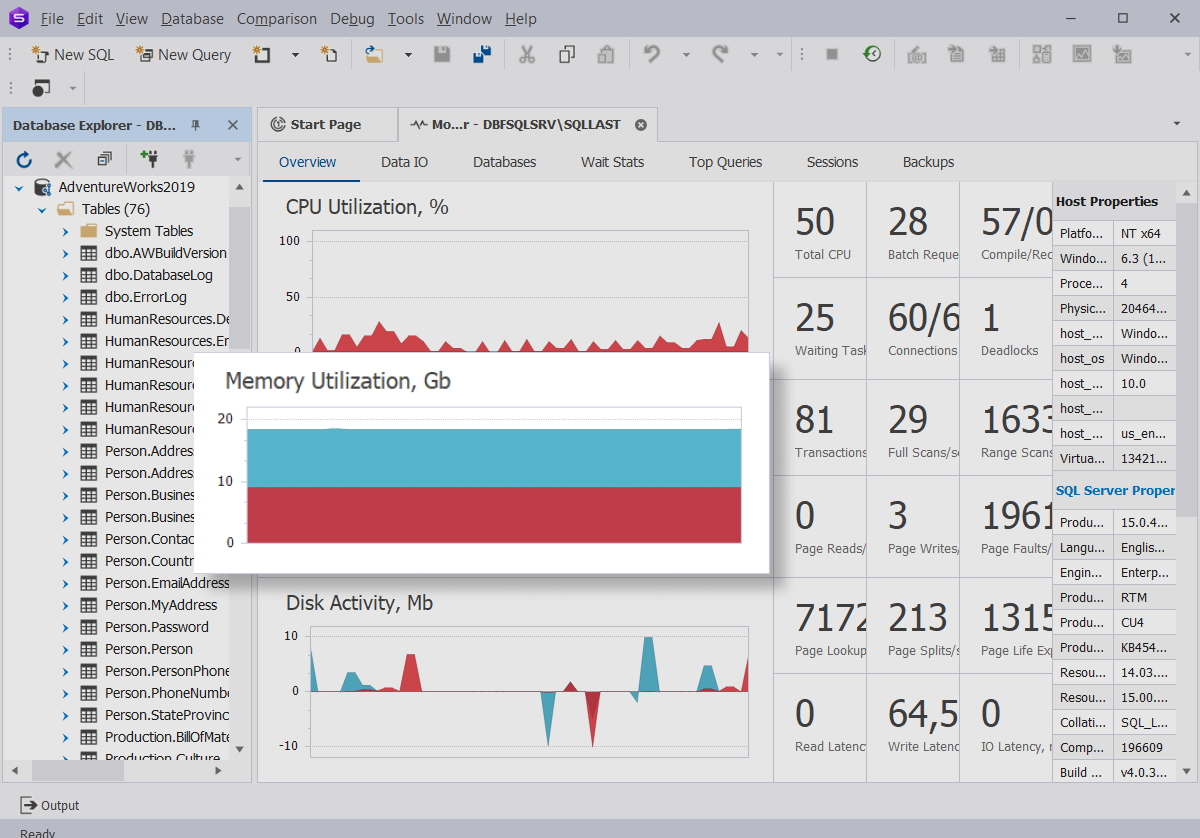
Memory Utilization
It is critical to have enough memory for the optimal performance of SQL Server.
On the graph, you can see how much memory is used in total, and how much memory SQL Server is currently using.
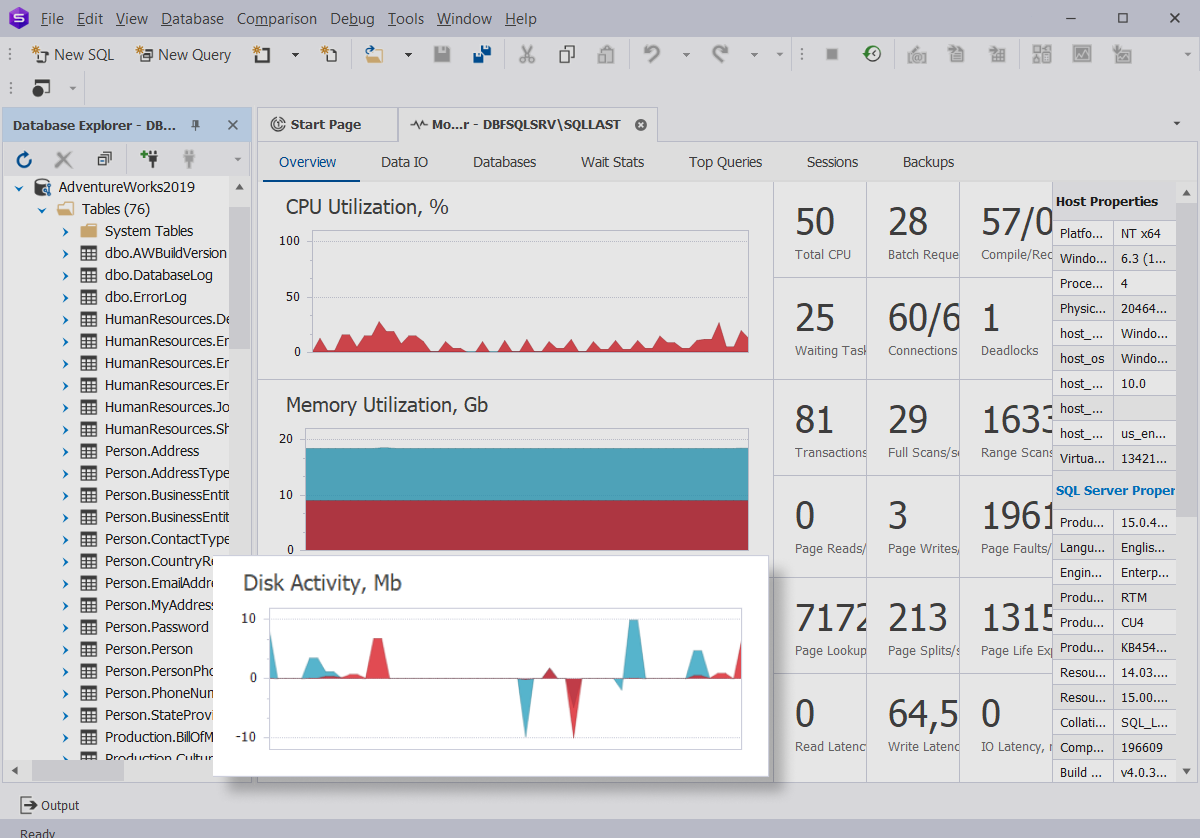
Disk Activity
Keep an eye on the disk activity to prevent unexpected behavior and
to detect any performance issues. The graph will help you easily
get a detailed view of your disk activity by displaying reads and writes (in Mb) of all disks.
Optionally, it is possible to track the workload on individual disks.
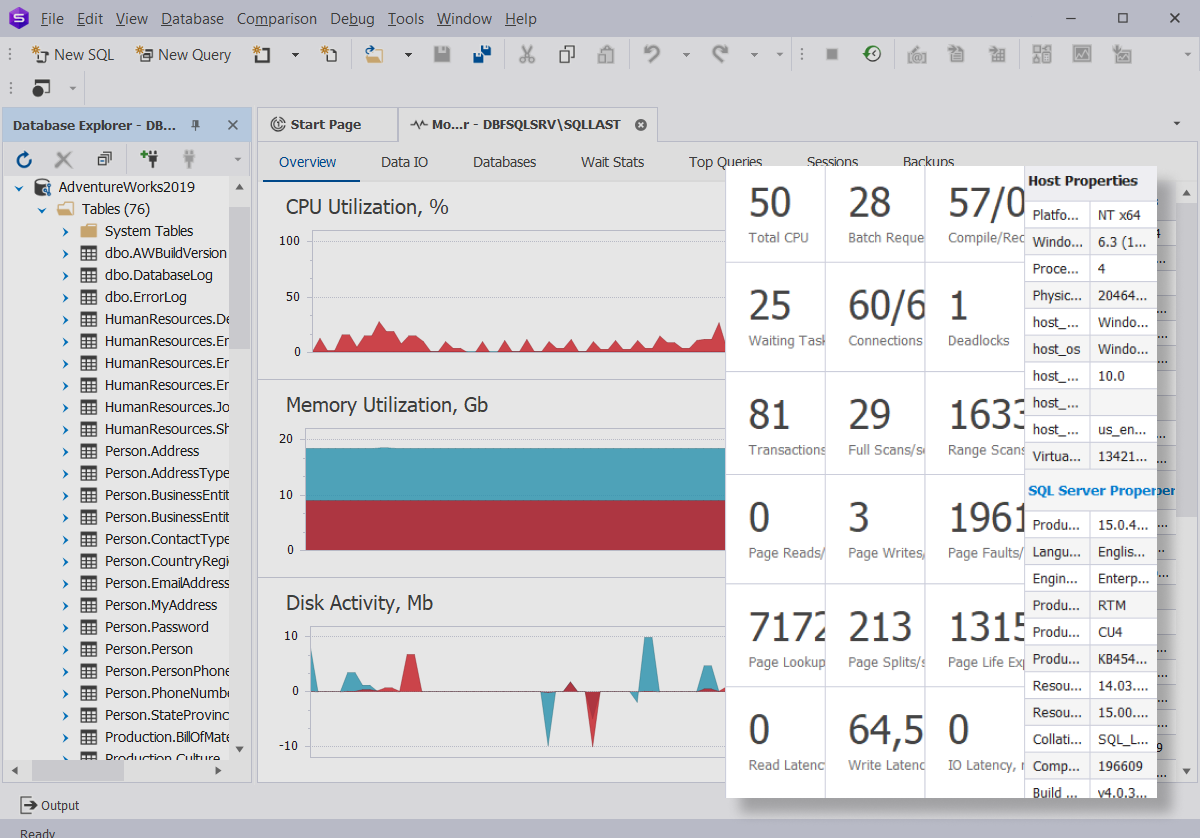
SQL Server Performance Metrics
Metrics on the Global Dashboard refers to the SQL Server performance and allows you to get deeper into what matters most. The diagnostic properties include
total CPU, batch requests per second, re-compilation, waits, active connections, deadlocks, transactions performed per second, full and range scans,
page reads and writes, page faults, page lookups and splits, page life expectancy, as well as read, queries with high I/O. In addition, you can view host and SQL Server properties.
This information allows you to get a clear and full picture of the performance within the disk, memory, and system resource usage. Having all this data makes
the investigation and troubleshooting process much effortless.
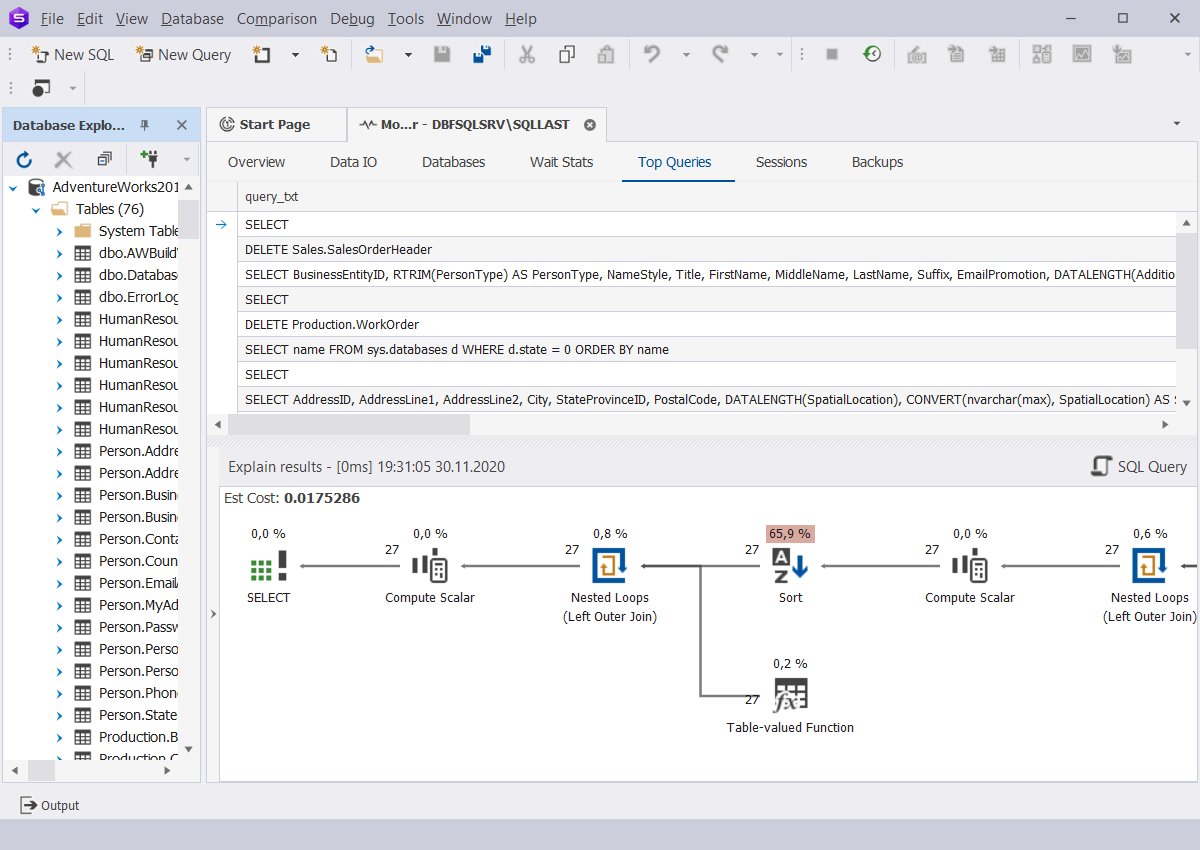
Top Resource Consuming Queries
Slow running queries use much resources, which may lead to poor performance and long query execution. To prevent these situations,
you can use the Top Queries tab to detect the most expensive and time-consuming queries by analyzing parameters such as execution count, total elapsed time, last elapsed time, min elapsed time, max elapsed time, total logical reads, last logical reads, and last execution time.
In addition, to solve any potential performance issues, view and analyze the Query Profiler tool, including
query execution plan diagram, top operations, plan tree, and SQL queries.
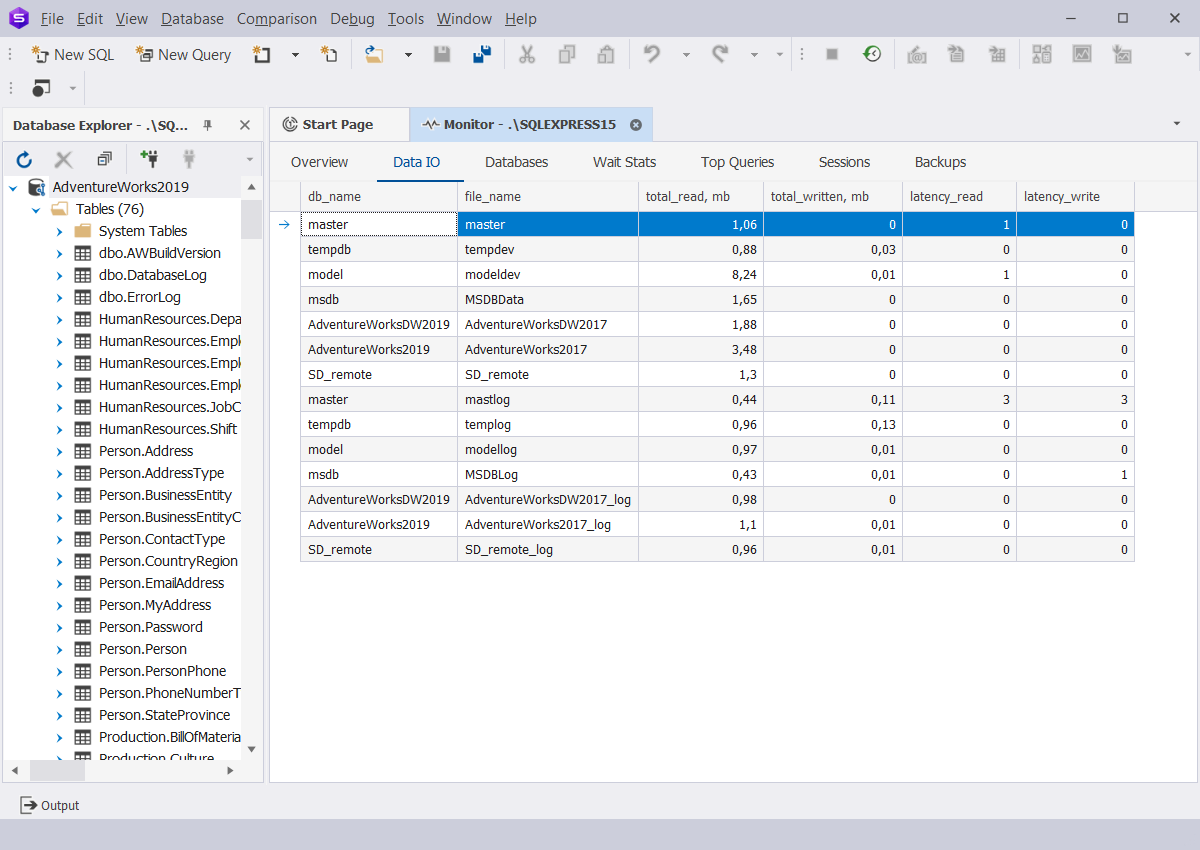
Data Input and Output
When troubleshooting SQL Server performance bottlenecks or facing the lack of memory issues, it is a good idea to view data input and output.
The Data IO section provides information about the number of disk and latency reads and writes,
added to the file, as well as the expected time required to complete a process.
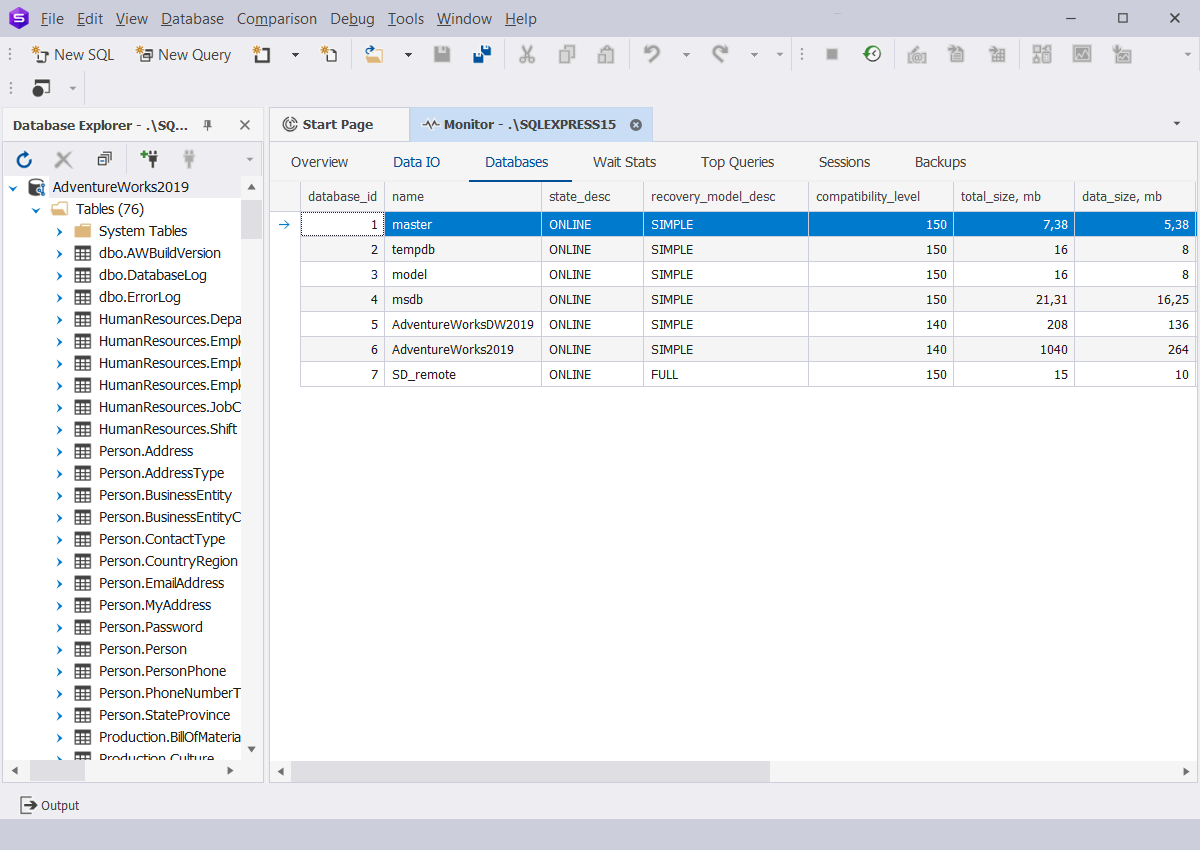
Databases
Tracking database size is vitally important for ensuring that disk resources won't be dried up. To investigate
and fix unexpected issues that may block application performance or cause database size growth, analyze the metrics
displayed on the grid. They include database ID, its status, type of recovery model,
compatibility with a particular SQL Server version, database total size, data and
log size, information on the transaction log space reuse, collation for the database,
as well as options to automatically close the connection and to shrink database files.
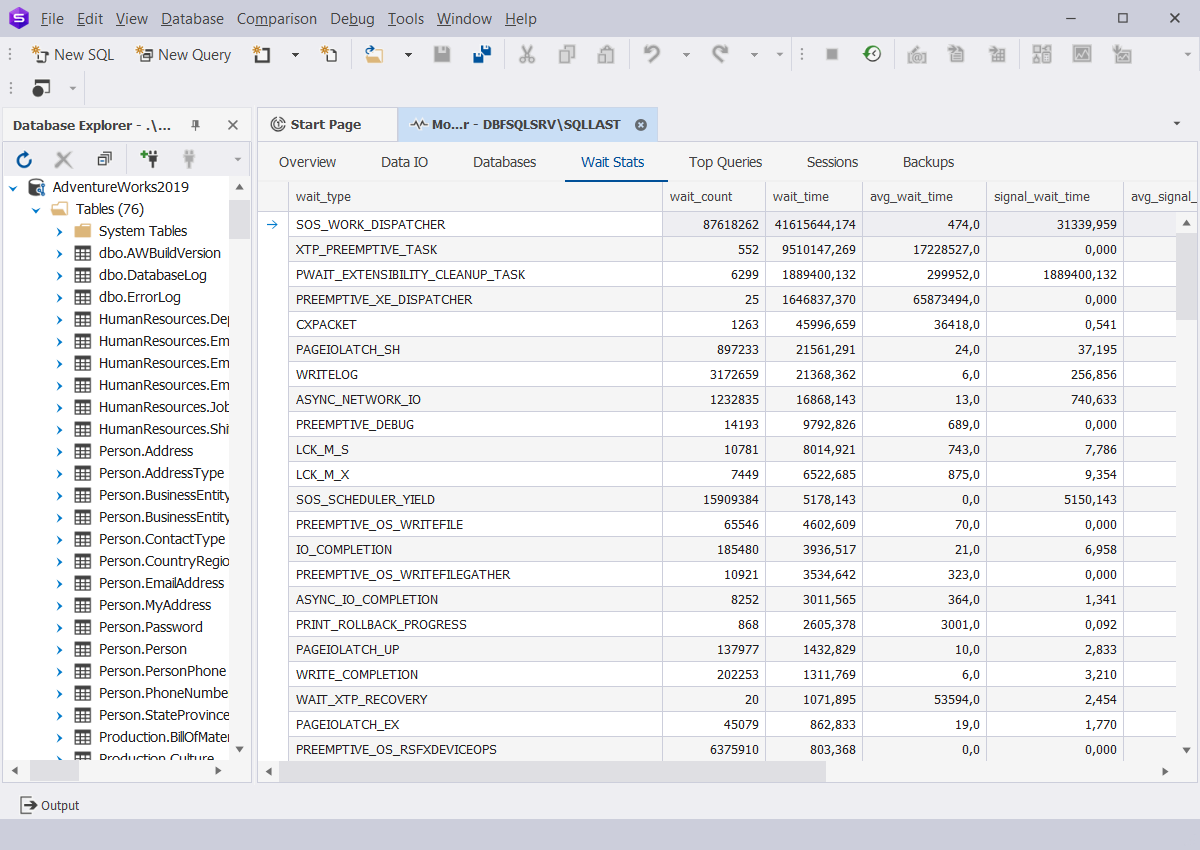
Wait Stats
If you want to explore what impacts the server performance, it is worth viewing
the Wait Statistics. It shows the name of the wait type and its total wait time, resource wait time, and
the number of waits. In addition, it allows you to monitor the waiting session
between the time when a query was added and when the CPU was ready to run it.
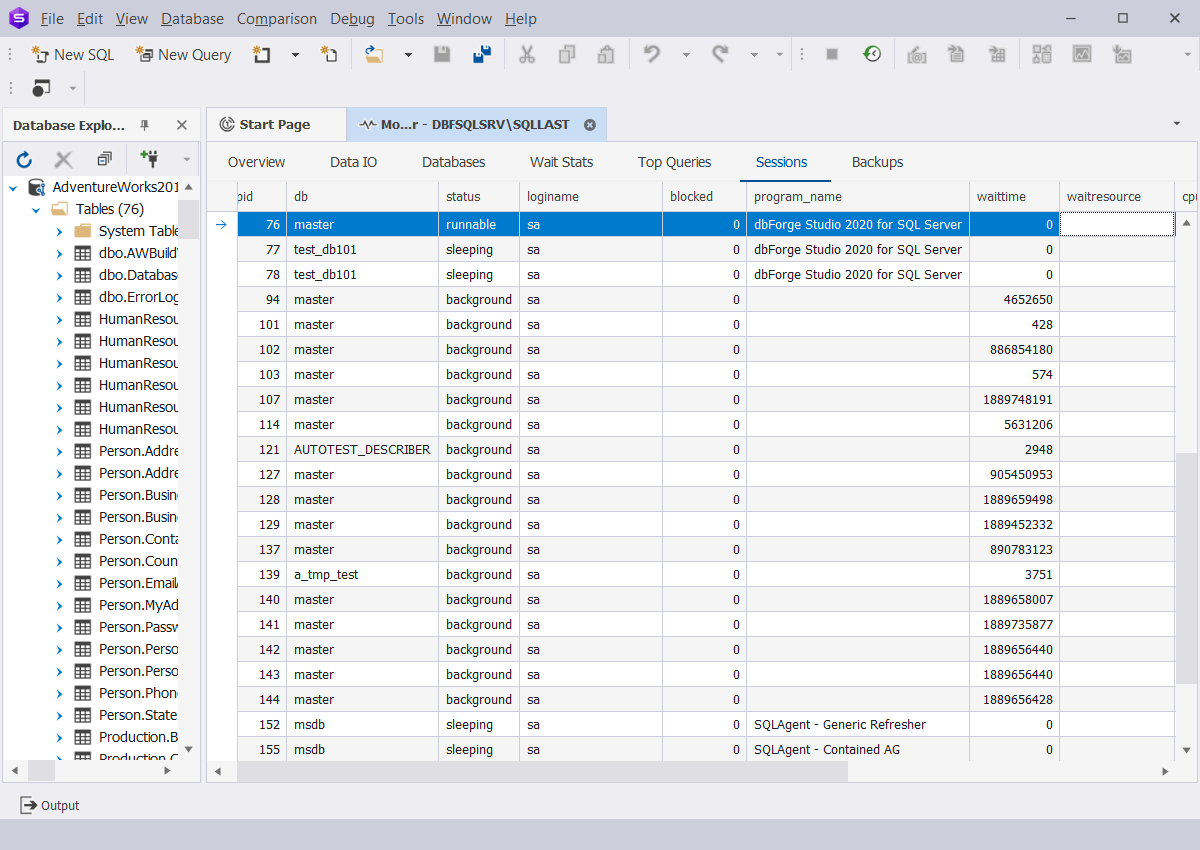
Sessions
The SQL Diagnostic Manager allows keeping track of active connections.
It displays session components such as SQL Server session ID, database, its state,
login name, session ID blocking the request, current waiting time, and textual representation
of a lock resource, if available. Additionally, you can view cumulative CPU time,
as well as disk reads and writes for the process, cache allocated for it,
time for logging into the server, and time for the last stored procedure executed remotely.
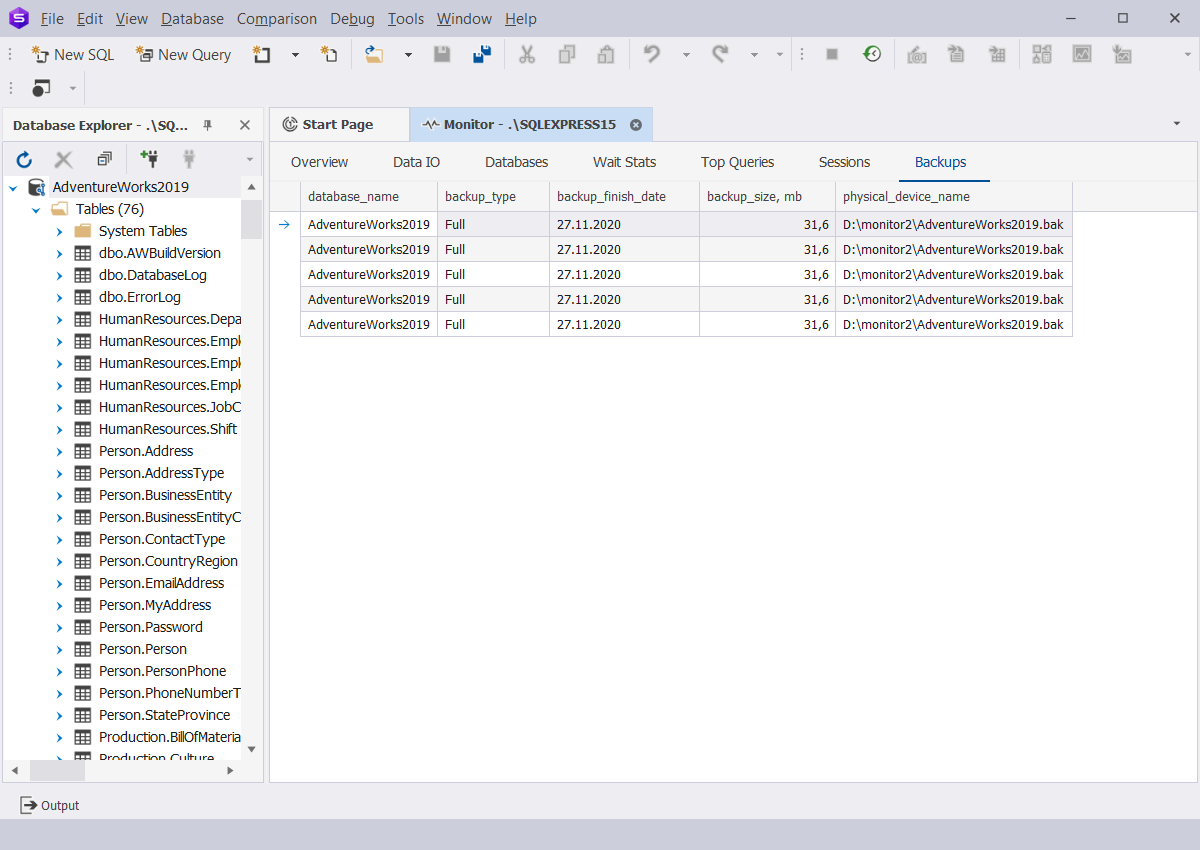
Backups
Back up data to protect and quickly access your data whenever you need. On the Backups tab, you can
see basic information for database backups created automatically: its type,
a date when the backup was created, size in Mb, and a path where the backup is stored.
SQL Diagnostic Manager is a comprehensive SQL Server performance analysis and diagnostic tool.
The tool helps you easily track and tune SQL Server performance using such metrics as CPU and memory utilization,
batch requests, wait and session statistics, disk reads and writes, data I/O, etc. The analysis of wait statistics and query execution diagram
and plan tree help you identify and efficiently solve any potential performance issues before they may cause database or server failure. In addition to the in-depth monitoring and analysis,
dbForge Studio for SQL Server offers a lot of useful and powerful database development and management tools.