Save Big on Cyber Monday! Up to 40% Off
ends in   {{days}}
Days
{{timeFormat.hours}}
:
{{timeFormat.minutes}}
:
{{timeFormat.seconds}}

SQL Query Optimization With SQL Profiler

Query Profiler is a powerful tool designed to assist in query analysis and performance optimization for SQL Server databases. It enables users to collect detailed statistics on executed queries, visualize execution plans, and identify performance bottlenecks such as slow-running SQL statements or inefficient indexing strategies.

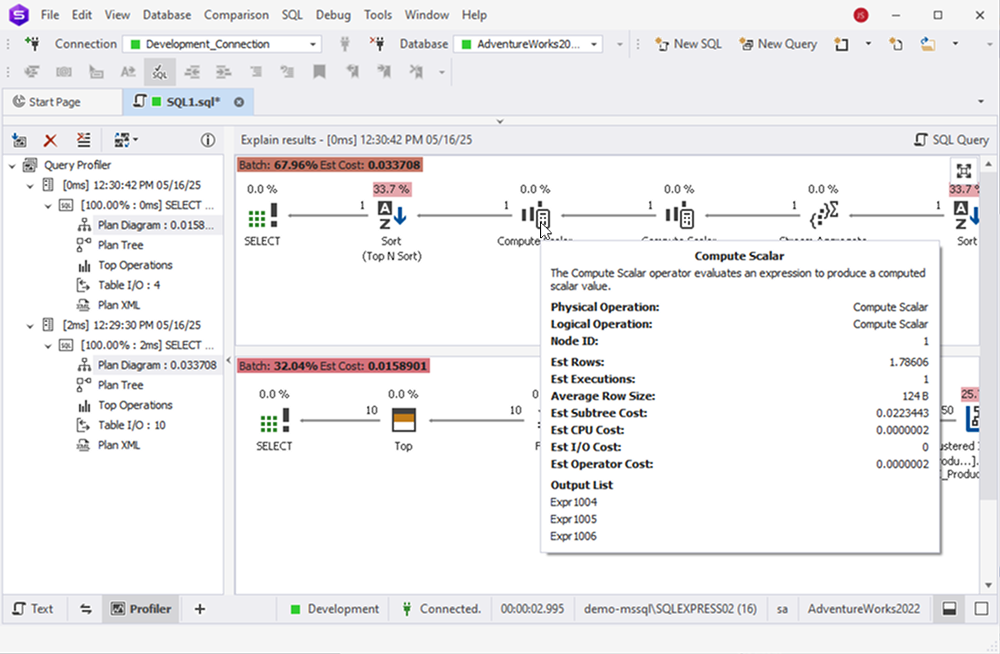
dbForge Studio for SQL Server provides Query Profiler — an integrated visual tool that helps developers and DBAs pinpoint problematic, resource-consuming queries, analyze their behavior, and optimize them for better performance.

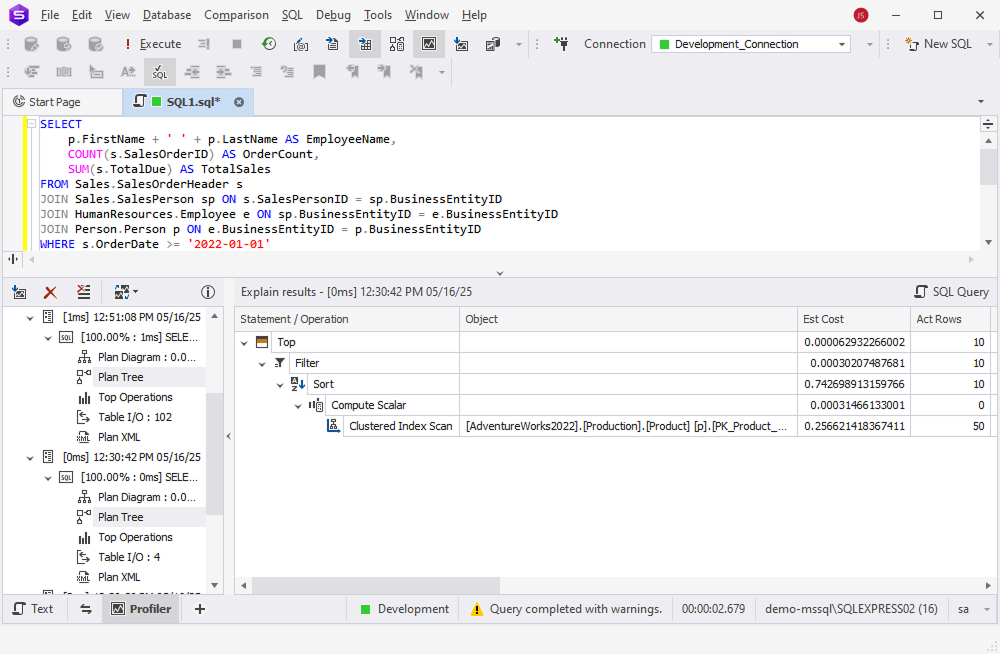
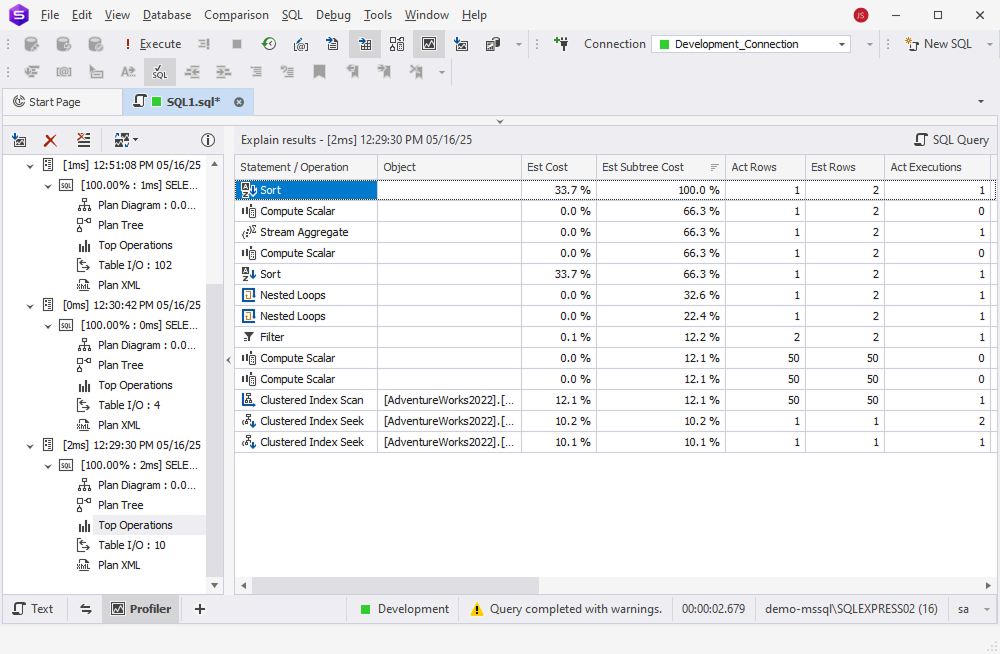
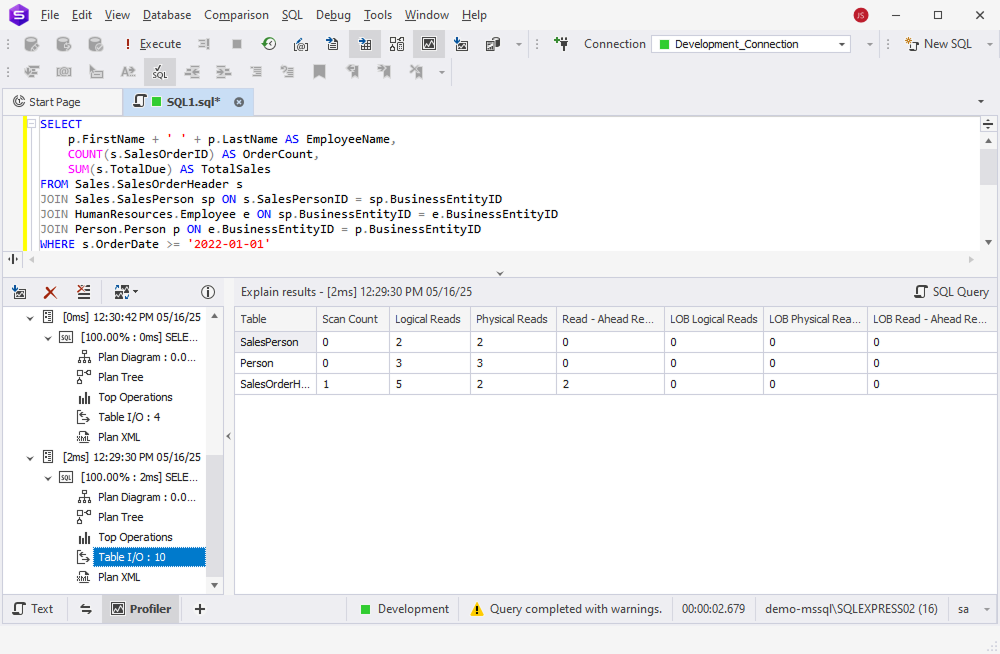
  • View the EXPLAIN plan and profiling results, and monitor session statistics
  • Save time on detecting bottlenecks in your queries
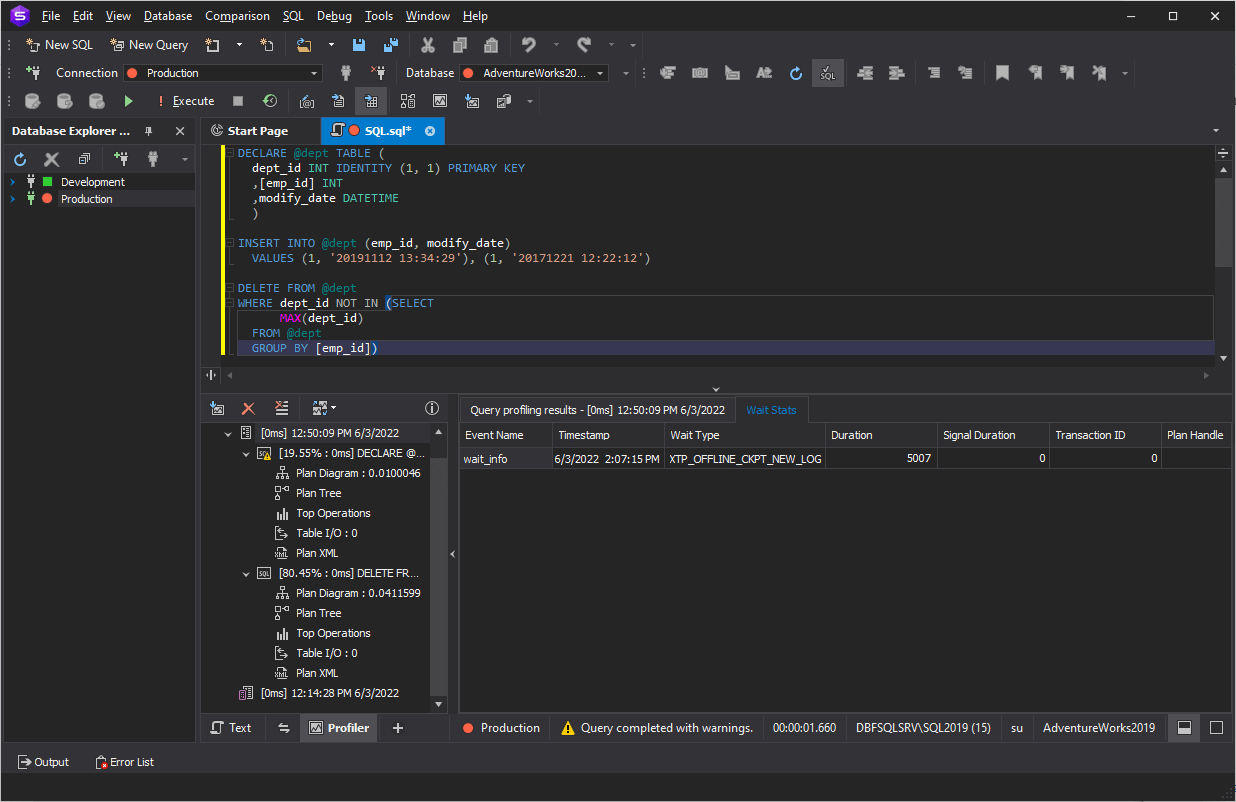
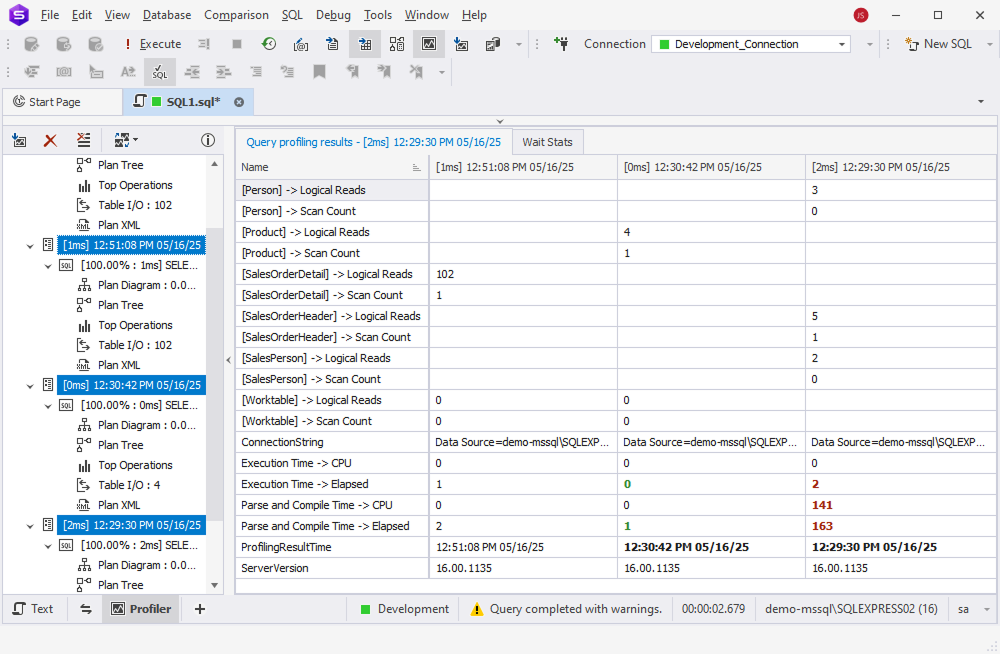
  • View time delays at different stages of executing a query
  • Compare differences in query profiling results visually
  • Get a clear and automated way to profile your database queries
  • Fetch SQL query data faster
  • Trace SQL queries and diagnose performance issues with slow queries

Execution plan diagram

In order to visualize and tune a query execution plan by pinpointing the slow-executing nodes, use the execution plan diagram.

It is a convenient graphical tool that allows you to easily assess the efficiency of your queries. Each query in the analyzed batch is displayed along with its cost, shown as a percentage of the total batch cost.

To view details about a particular node, simply hover over it.

Visualize queries with SQL Query Profiler Plan Diagram

Wait statistics

With the Wait Stats tab, which follows the Query profiling results tab, you can easily identify potential bottlenecks in your query.

The tab displays a list of events with corresponding timestamps and associated wait information. Specifically, it shows the event name, the exact time it occurred, its duration, the type of wait, signal wait time, transaction ID, and additional relevant details.

View waiting statistics in Query Profiler

Plan tree

Plan tree displays the EXPLAIN results generated by the executed query. The statements and operations are organized hierarchically in a tree view. Each operation is accompanied by relevant details such as the associated database objects, estimated cost, number of rows, and the executor for that part of the query.

Use the Plan Tree tab to gain insight into how SQL Server executes a SELECT statement. This view helps identify performance improvement opportunities, such as adding indexes or optimizing joins.

Visualize queries with SQL Query Profiler Plan Tree

Top operations list

The top operations list allows you to quickly identify the most time-consuming operations. Seeing all the resource- and performance-intensive operations at a glance helps you pinpoint which parts of your SQL code require optimization.

This tab is similar to the Plan Tree, but the entries are not displayed hierarchically. By default, SQL Profiler sorts them by the highest estimated cost. You can also sort the list by CPU, I/O, or other cost metrics to gain a visual representation tailored to your analysis needs.

View the most time-consuming operations in top operations list

Table I/O

Query Profiler also includes the Table I/O tab, which presents the input-output statistics for all tables involved in the execution plan.

To view this information, simply click the Table I/O tab in Query Profiler—the relevant data will be displayed in a clear, easy-to-read format.

Use the Table I/O tab to examine detailed metrics such as scan count, logical and physical reads, and other interactions with database tables.

Compare query differences in the profiling results grid

Compare profiling results

The key to SQL query optimization lies in comparing the profiling results after making changes to your query.

By selecting profiling results from multiple query executions, you can view the differences highlighted in the grid, enabling an effective comparison of overall execution metrics and session-specific statistics.

Improvements in performance are highlighted in green, while declines are marked in red, helping you instantly identify which changes had a positive or negative impact.

View query differences on the Session Statistics tab

Conclusion

Query Profiler is a query optimization tool that helps you profile and improve SQL query performance, as well as keep track of the differences in profiling results when executing the query several times. With this tool, you can easily identify slow running queries, examine the workload, and analyze bottlenecks to resolve performance issues in SQL databases. Profiling can also be used to determine the unexpected behavior of queries.

FAQ

What is SQL query profiling?

Query profiling is the process of analyzing how a database query is executed in order to understand its performance characteristics. It helps identify bottlenecks, inefficient operations, or missing indexes by providing detailed insights into each step the database takes to process the query.

What kind of data does query profiling provide?

Profiling can reveal execution plans, number of rows processed, index usage, wait events, CPU time, I/O statistics, and memory consumption during query execution. It also highlights trends across multiple executions for easy comparison.

How can query profiling help with performance tuning?

By analyzing the collected profiling data, you can identify expensive operations, optimize SQL logic, and adjust indexes or schema structures. This leads to faster response times and more efficient database usage.

Is query profiling supported in all database systems?

Most modern relational databases (e.g., SQL Server, SQL Azure) provide some form of query profiling or execution plan analysis, although implementation and feature sets may vary.

Feature comparison

Features

dbForge Studio for SQL Server
SQL Server Profiler
Visual SQL EXPLAIN plan
Yes
No
Session statistics monitoring
Yes
Yes
Query plan visualization
Yes
No
Profiling history for future reference
Yes
No
Comparison of profiling results
Yes
No
Printing of profiling results
Yes
No

Availability in the editions of Studio for SQL Server

Feature

Enterprise
Professional
Standard
Express
T-SQL Query Profiler
Yes
Yes
Yes
None