T-SQL Debugger for SQL Server
T-SQL Debugger is one of the most invaluable developer tools to be found in dbForge Studio for SQL Server. It offers the quickest and easiest way of debugging SQL queries, stored procedures, triggers, functions, and T-SQL scripts. With its help, you don't need to scrutinize your code in order to find potential performance bottlenecks and other possible issues. You just let the Debugger do the job for you.
In addition, don't overlook other SQL coding tools offered by the Studio, such as code autocompletion, formatting, instant syntax check, refactoring, and a library of predefined and custom code snippets. Taken together with the Debugger, they offer the ultimate GUI-driven coding experience for software and database developers of all skill levels.
The importance of a reliable SQL query debugger becomes all the more relevant considering its typical absence from the most widely used tools for SQL development. Take SQL Server Management Studio, for instance. As you might know, it used to have an integrated debugger, yet it was deprecated in v18 and is no longer available. On the contrary, you have dbForge Studio, whose ever-evolving T-SQL Debugger will easily become indispensable for your daily work. Let's take a closer look at it.
An overview of T-SQL Debugger
The Studio's T-SQL Debugger allows you to find issues with your scripts, stored procedures, stored functions, and triggers using step-by-step execution and thorough examination. With the Debugger, you can do the following:
- Set breakpoints in your code to pause the execution at specific lines
- Step through code line by line to see how each line is executed
- Monitor the current values of variables, expressions, and query results to analyze how data changes during the execution process
- Handle exceptions in T-SQL code by highlighting the exact line where the error occurs
Here's how SQL debugging works in real time.
Requirements to start debugging SQL
Before starting your work with the Debugger, make sure that the following requirements are met:
- The server-side and client-side components of T-SQL Debugger must be installed.
- Debugging firewall exceptions on the client and server sides must be enabled.
- Your Database Engine SQL document must be connected using Windows Authentication or SQL Server Authentication under a login that has a fixed sysadmin server role.
- Your Database Engine SQL document must be connected to a Database Engine instance of SQL Server 2005 SP2 or later.
- The database you're working with is not in the single-user mode.
How to debug a trigger in SQL Server
To make sure that your trigger is running and is called correctly, you might need to debug it. Debugging triggers can be challenging as they perform complex operations silently.
If the trigger is fired by a stored procedure, you can debug both database objects as a whole, stepping into or over a trigger.
Let's illustrate how to debug a trigger in SQL Server step by step.
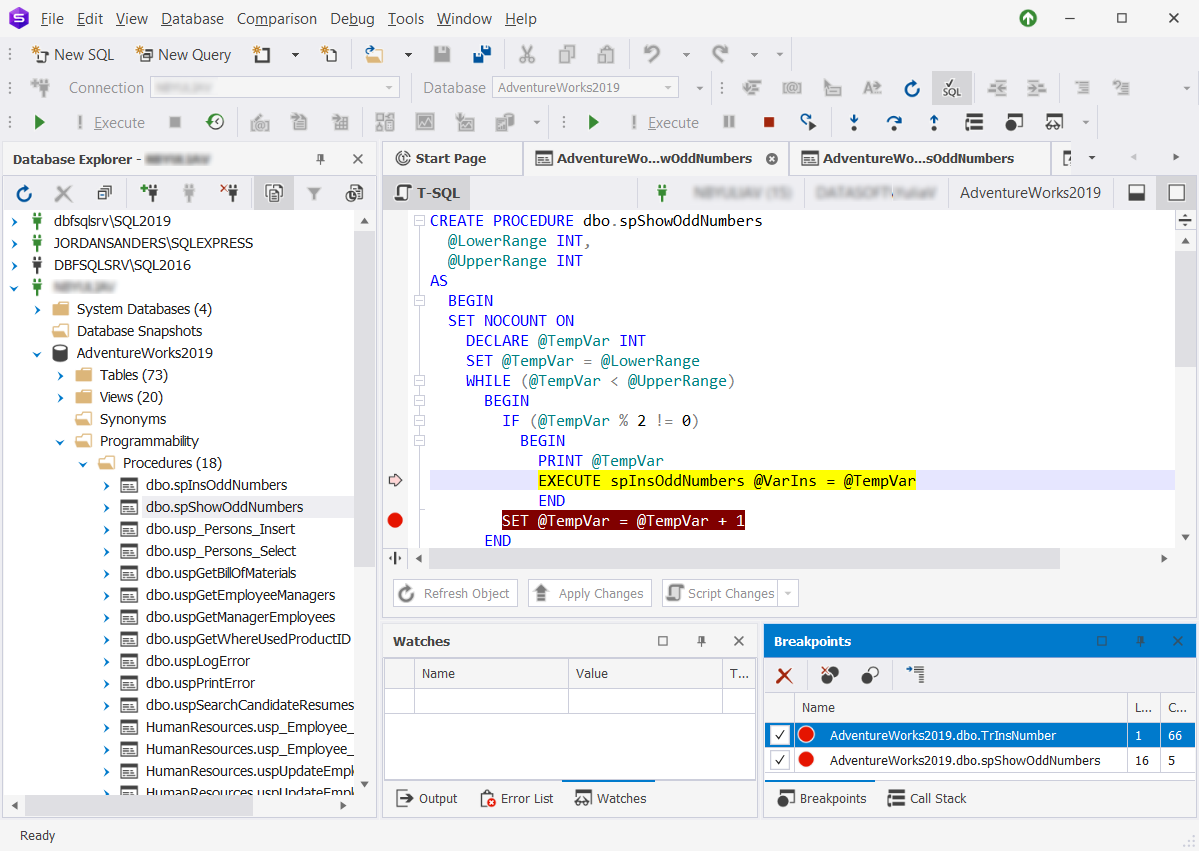
In Database Explorer, double-click the trigger that you want to debug. In the SQL document that opens, you need to set a breakpoint. To do that, right-click the line of the code where you want to set a breakpoint and select Insert Breakpoint. The lines with the breakpoint will be highlighted in red.

In Database Explorer, double-click the procedure to open it. In the SQL document that opens, set a breakpoint for the stored procedure that will fire that trigger. The breakpoints that you have inserted into the trigger and stored procedure will be added to the Breakpoints pane where you can delete, enable or disable all breakpoints or the selected ones, or go to the source code.
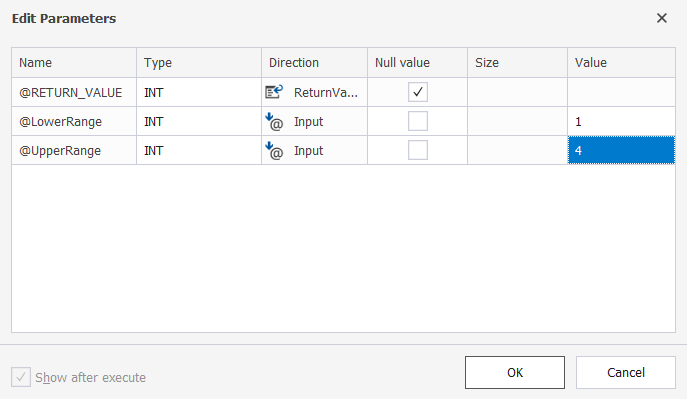
In the Debug menu, click Start to launch debugging. In the Edit Parameters dialog that opens, enter the values of input variables and then click OK. The variables LowerRange and UpperRange define the range of values.
To step through the code, click Step Into or press F11 on the Debug menu or toolbar. Alternatively, you can press CTRL+F5 to move directly to the breakpoint. When you press F11 again, you will step into the trigger.
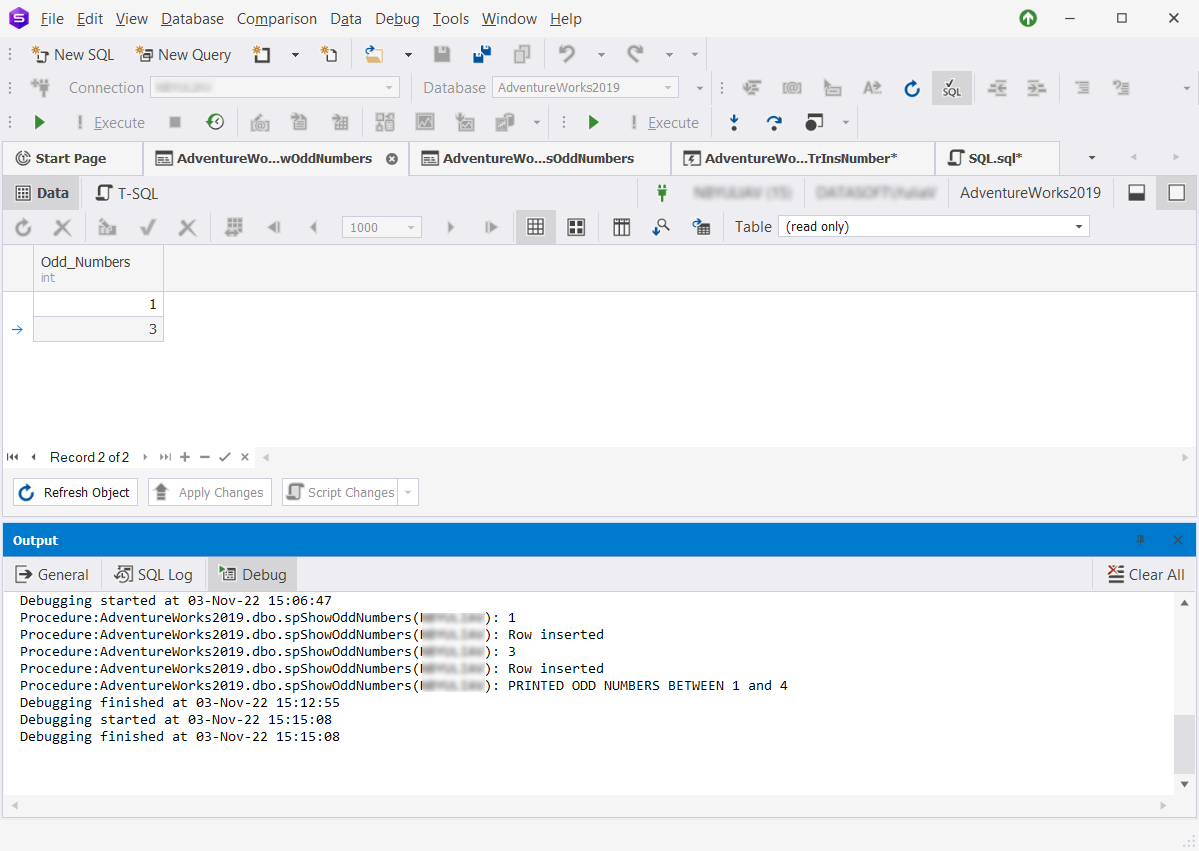
After debugging is complete, the Output pane automatically opens where you can view and analyze the execution result of the debugging process.
How to debug a stored procedure in SQL Server
T-SQL Debugger allows you to interactively debug stored procedures using traditional debugging operations:
- Setting breakpoints
- Evaluating and editing variables
- Examining the call stack
- Stepping into, out, and over individual statements
- Suspending the execution of your code
The Debugger is well-elaborated to suit even the most demanding needs. The Call Stack pane allows tracking calls to nested procedures. The Watches pane, in its turn, gives a possibility to evaluate variables and parameters.
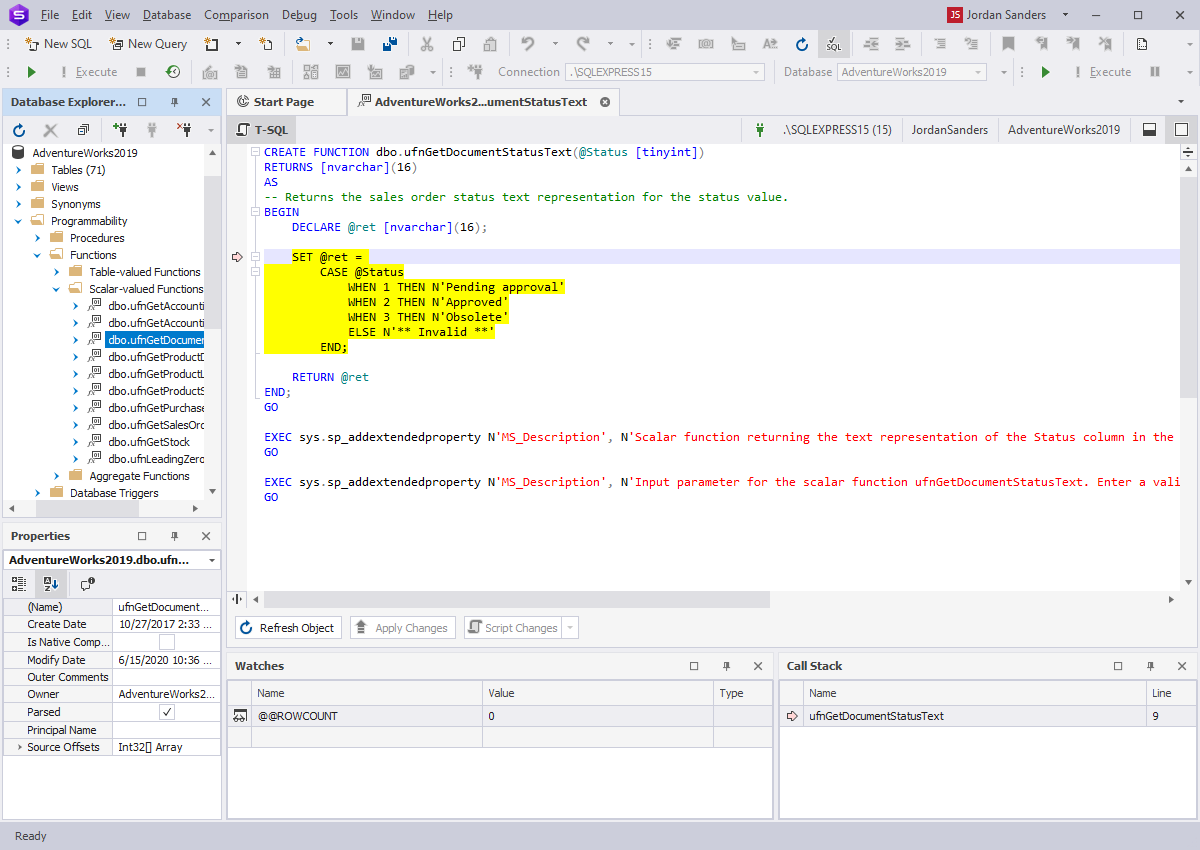
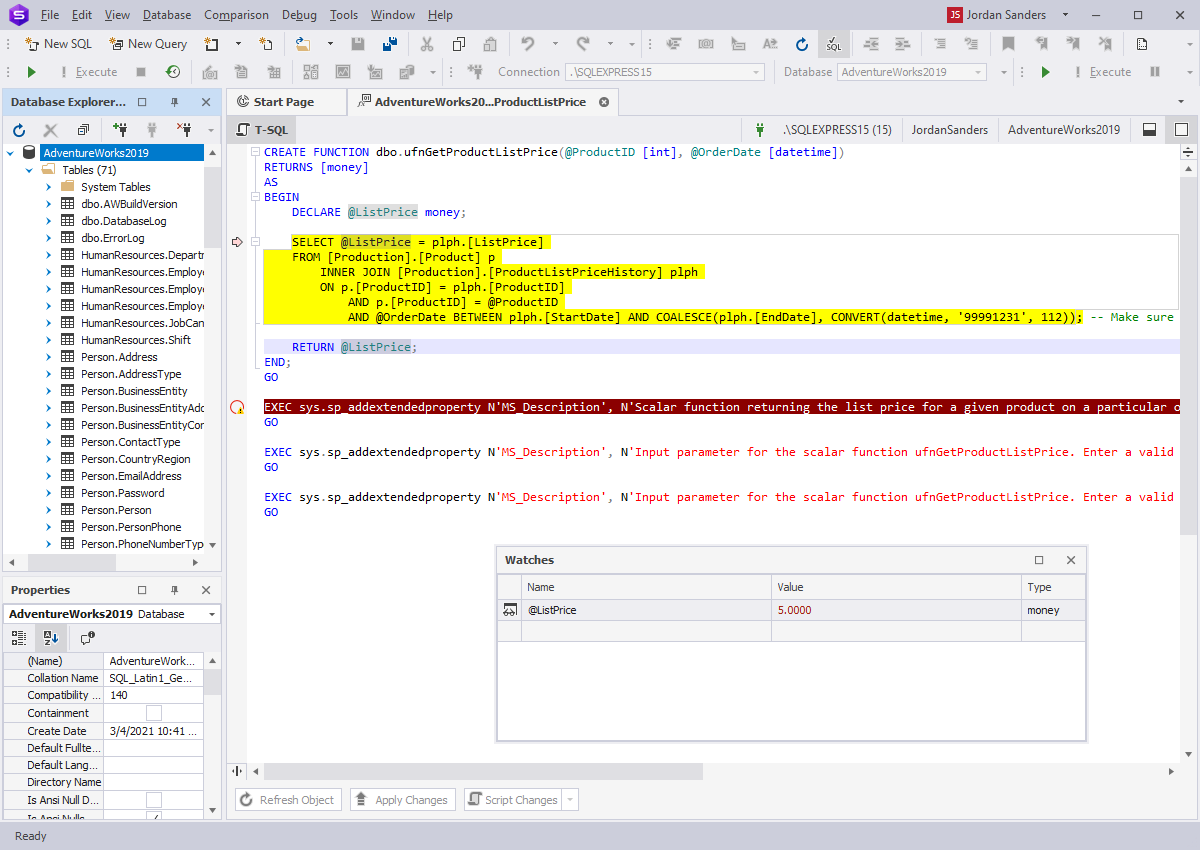
How to debug a stored function in SQL Server
Functions are generally not so easy to diagnose and debug. Open the procedure that calls your function and insert a breakpoint for the function you want to debug. Then, start debugging. Step through the code using the F11 key or Step Into, or press CTRL+F5 to move directly to the breakpoint. Press F11 or click Step Into to get inside the stored function. Clicking Step Over will continue stepping through the stored procedure.
How to debug an SQL script
Debugging large and complex SQL queries can be a daunting task. The script execution causes errors but they do not directly point at the problematic places in the script. Still, there is nothing that the Debugger can't do.
To debug a SQL script, open it in the SQL code editor and start debugging. Then, set breakpoints to the statements, if required. If a statement is invalid, an error message will appear on the error list, but the debugging process will continue. You can suspend the debugging of a query by selecting the Stop Debugging command from the Debug menu. You can also use different step commands to trace your SQL script.
The Call Stack and the Watches panes are also available for this debugging task.
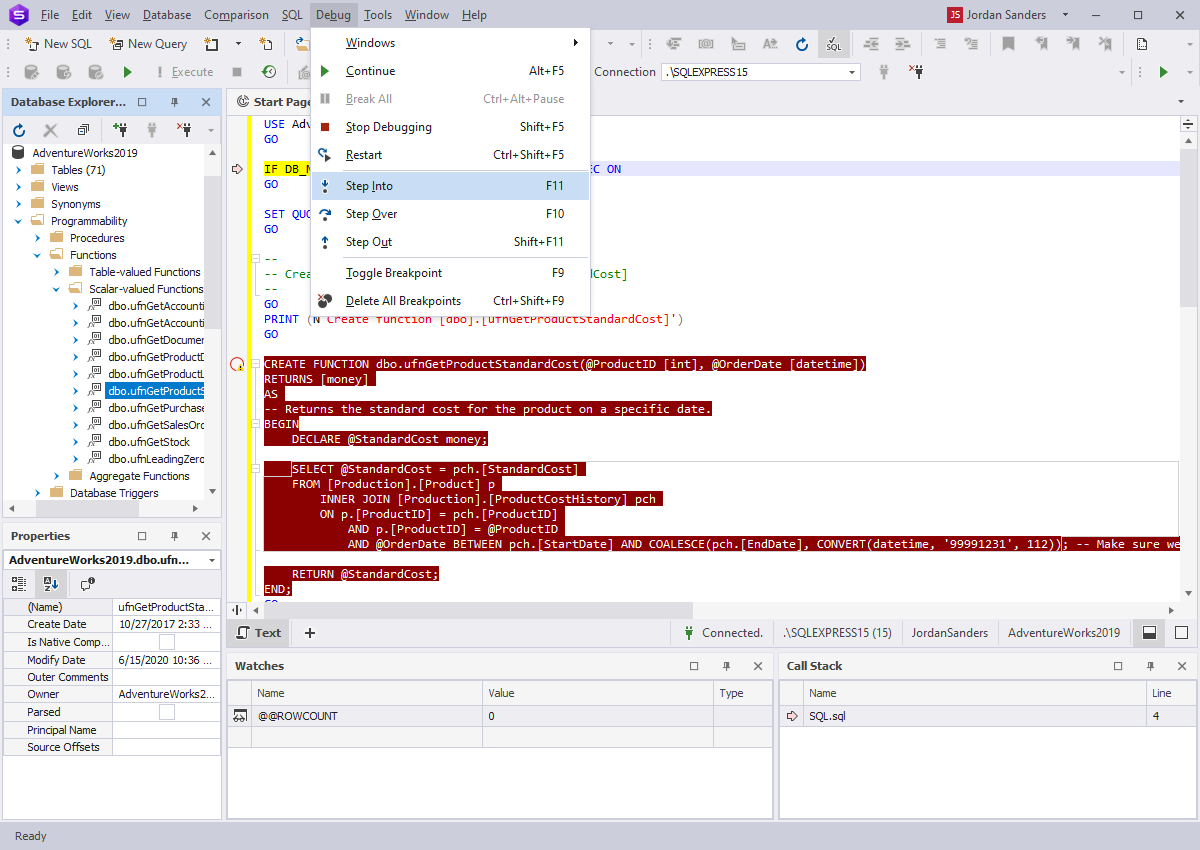
Executing Step Into, Step Over, and Step Out debugging commands
The Debugger puts you in full control over the process using the following commands:
Step Into: If a line of your code contains a function call, the Debugger will enter the called function and continue line-by-line debugging there.
Step Over: With this command, if your line contains a function call, the function will be executed and the result will be returned without debugging each line.
Step Out: This command should be used if you are inside a function and want to return to the preceding stack frame.
The Continue, Stop Debugging, and Restart commands allow you to directly control the flow of the SQL Server debugging process.

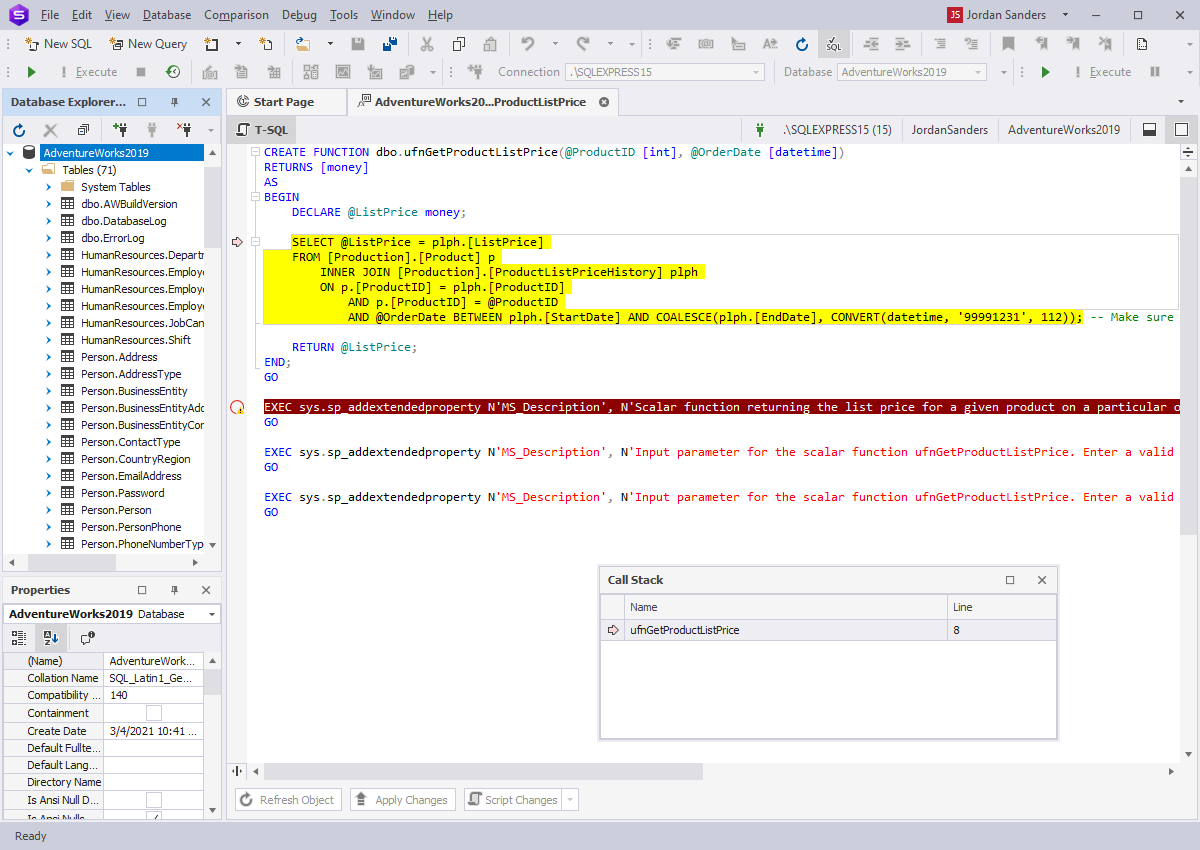
Call Stack browsing
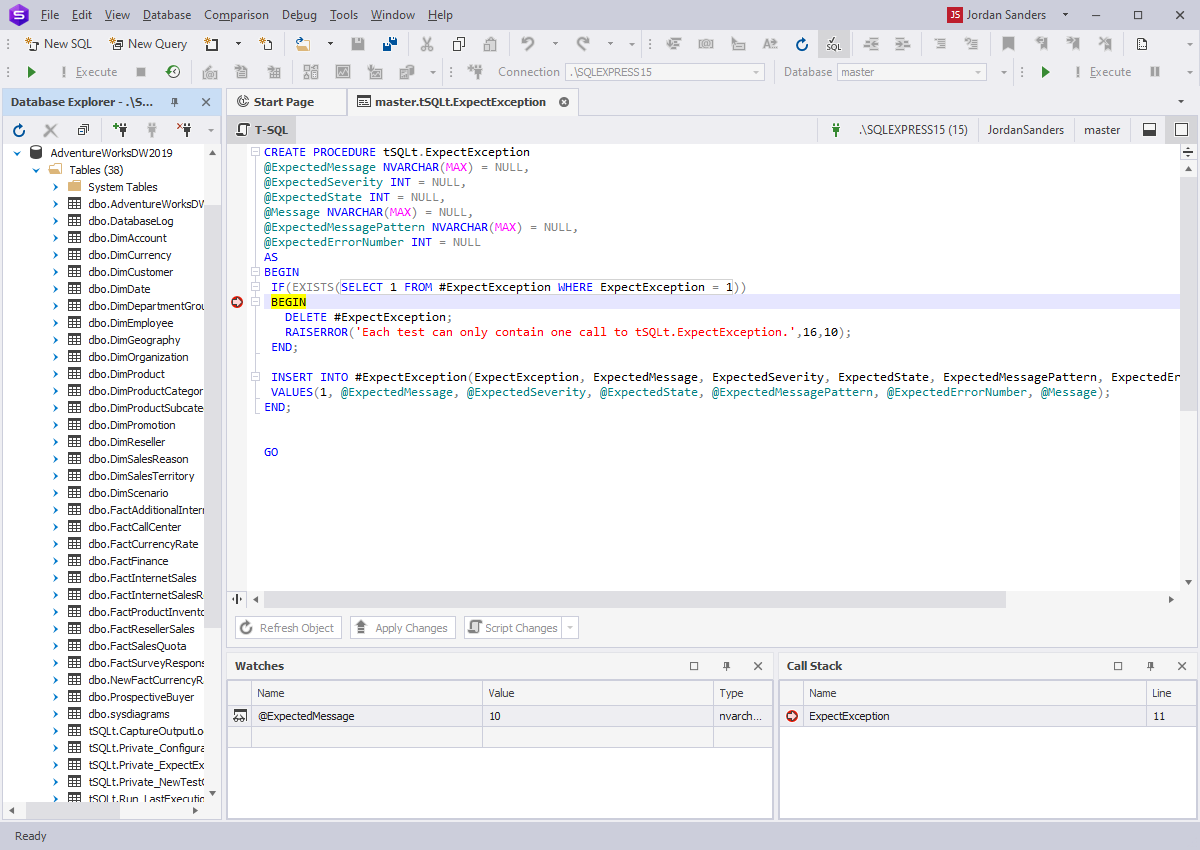
To keep track of the stored procedures or function invocations, you can use the Call Stack pane, which is available only in the debug layout. The pane can also be used to find and analyze logic errors when executing queries. The Call Stack pane represents a stack frame of functions, stored procedures, and triggers being called, displaying the most recent ones at the top of the pane.
In the Call Stack pane, you can do the following:
- Navigate between calls
- Identify the stack frame where the T-SQL Debugger is currently located (indicated by the yellow arrow)
- Identify the parent code which has called the trigger (indicated by the green arrow)
- Detect the line where the Debugger has stopped the execution
- Switch to the source code
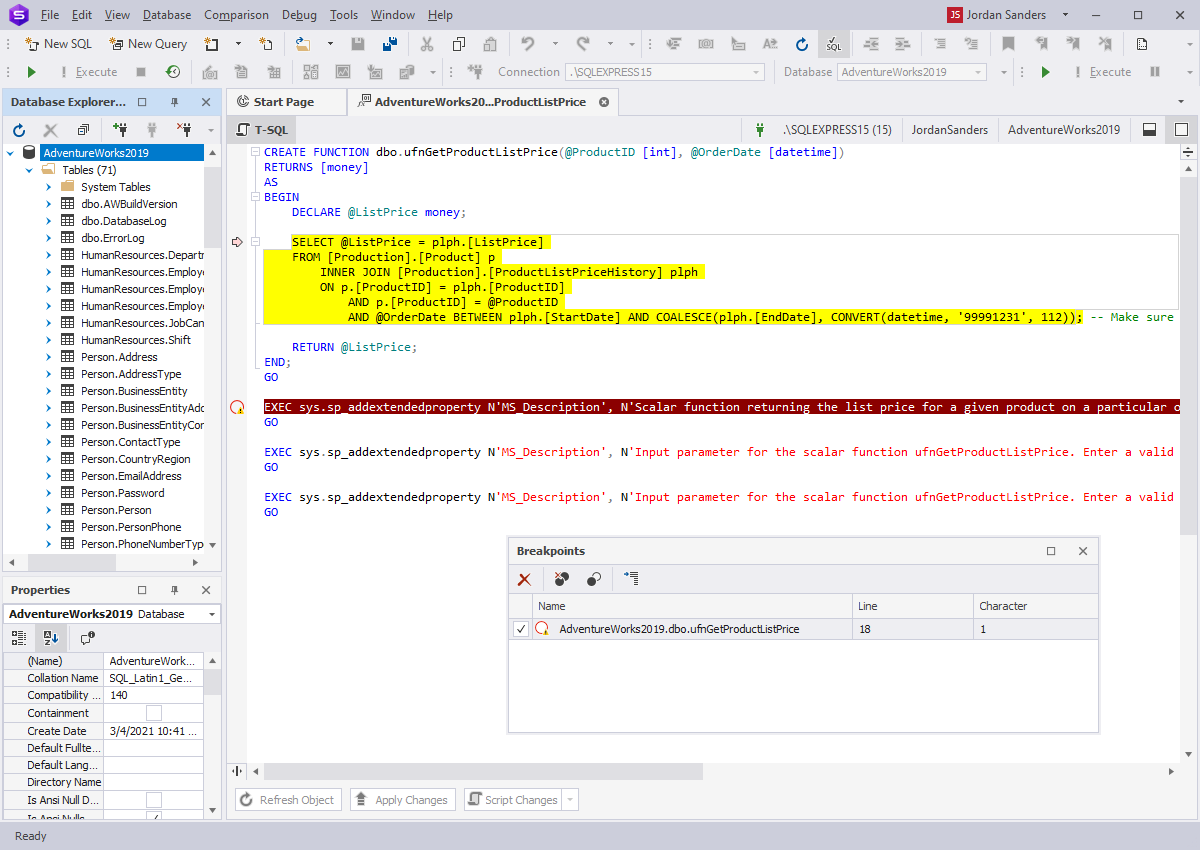
Working with breakpoints
During a debugging session, breakpoints can be used to suspend or pause code execution. This helps you take the time to analyze your code and evaluate variables. The breakpoints you place are displayed in the Breakpoints pane. After the code breaks, you can launch the debugging process with Step Into, Step Over, Step Out or Run to continue debugging.
In Debug > Breakpoints, you can manage breakpoints in the following way:
- View a list of breakpoints along with their properties that are currently set in the code
- Delete a selected breakpoint or all breakpoints
- Enable or disable breakpoints
- Switch to the source code
Analyzing variables in the script
While stepping through the code, you can add watches (expressions) and evaluate or modify local variables. When the Debugger pauses code execution, the expressions are displayed in the Watches pane, which is available only in the debug layout.
The Watches pane shows the following information:
- Name: The variables and expressions run in the Debugger
- Value: The evaluation result of the expression specified in the Name column; the evaluation is based on the current stack frame selected in the Call Stack pane
- Type: The data type of the expression
Best practices for effective debugging
Now that you've learned how to debug in SQL Server using the Studio's T-SQL Debugger, let's proceed to several best practices that will make the process even more effective.
- First of all, make sure there are no errors in the syntax of your queries. This is where the Studio's instant syntax check comes in handy, highlighting potential issues as you type.
- Apply formatting to your code to make it clean and readable. For this, you can use the Studio's integrated SQL Formatter or other similar tools.
- Inspect query execution plans to identify possible bottlenecks in your queries. You can use specialized tools to do that; one of those is the Studio's integrated Query Profiler.
- Wrap your code in transactions (using BEGIN TRANSACTION, COMMIT, and ROLLBACK), so that any changes made to your databases are not permanent.
- Isolate complex subqueries and run them separately to verify that they return the expected results.
- Use temporary tables for inspecting intermediate data, breaking down complex queries, and testing different parts of your code. However, make sure you use them carefully and drop them after debugging to avoid unnecessary resource consumption.
- Avoid using cursors where they can be replaced with window functions, which are better in terms of performance and readability.
- If you are debugging a stored procedure or script, use PRINT to output intermediate results and trace the flow of your code.
- If you are working with dynamic SQL (using EXEC or sp_executesql), test individual SQL commands separately by printing or executing them before running the full statement.
Watch T-SQL Debugger in action!
There's nothing quite like a compelling video, so here it is. In less than a minute, you will see how to initiate and control the debugging process in dbForge Studio for SQL Server.
Conclusion
Now that you've seen how effortless it is to debug a SQL query, procedure, trigger, or function, you can easily give the Debugger a go yourself. To do that, download dbForge Studio for a free 30-day trial. This is more than enough to explore all of its features, including code completion, formatting, refactoring, and, of course, T-SQL script debugging. Besides that, you can also discover the abundance of other features for database management, administration, and maintenance that will make your routine operations with SQL Server databases a breeze.
FAQ
In dbForge Studio for SQL Server, right-click the stored procedure in Database Explorer and select Step Into. In the Edit Parameters dialog, enter input values and click OK to launch the debugger. Use F11 to step through the procedure line by line.
To track variable values during execution, right-click a variable and choose Add Watch. The values will appear in the Watches pane. Set breakpoints by right-clicking a line and selecting Insert Breakpoint, or use the gray margin next to the code.
If your procedure calls other objects like nested procedures or triggers, the Debugger will automatically step into those too. Use the Call Stack pane to trace the execution flow across all database objects.
In dbForge Studio for SQL Server, right-click it in Database Explorer and choose Step Into or press F11.
Next, in the Edit Parameters dialog, enter the required input values and click OK. Once debugging starts, the yellow arrow will highlight where the execution pointer is currently located.
To stop tracing, click Stop on the Debug toolbar.
To verify execution, run the procedure and check the output message. You can also view the results by retrieving data from the target table. Right-click the table in Database Explorer and choose Retrieve Data to display the result in a grid.
To execute a stored procedure in SQL Server, enter EXECUTE in a new query window, specify the required procedure, provide values for parameters (if applicable), and click Execute.
You can also right-click the procedure in dbForge Studio → Generate Script As > EXECUTE > To New SQL Window.
The built-in Transact-SQL Debugger was removed from SSMS starting with version 18. To debug SQL code in SQL Server 2025, use SQL Complete by Devart, which adds full debugging support back into SSMS.
To start debugging a stored procedure, in Object Explorer, right-click the procedure, and select Script Stored Procedure as > EXECUTE To > New Query Editor Window. Click Step Into or press F11 to begin debugging. Continue clicking Step Into repeatedly until a new SQL document containing the CREATE statement appears.
In the opened CREATE statement, set breakpoints by right-clicking a line and choosing Insert Breakpoint, or press F9. Use Alt+F5 to continue debugging. Breakpoints are managed in the Breakpoints pane.
To monitor variable values, right-click a variable and select Add Watch. Use F11 to step into code line by line, or F10 to step over functions and triggers.
Yes, you can debug a SQL query using the T-SQL Debugger in dbForge Studio for SQL Server. While most tools (like SSMS) no longer offer built-in debugging, dbForge Studio allows you to step through SQL scripts just like stored procedures.
Here’s how it works:
- Open your SQL script in the editor.
- Set breakpoints by clicking in the gray margin or pressing F9.
- Start debugging via the Debug menu or by pressing Ctrl+F5.
- Use F11 (Step Into), F10 (Step Over), and Shift+F11 (Step Out) to control execution flow.
- Monitor variable values in the Watches pane or hover over them during debugging.
- Check the Call Stack pane to trace execution through functions or procedures.
- View results and error messages in the Output pane once execution completes.
This makes it easy to trace logic errors and identify problem areas even in complex queries.
In SQL Server, you can’t debug a function directly, but you can debug it by stepping into it from a procedure that calls it. Here’s how to do it in dbForge Studio for SQL Server.
In Database Explorer, open the procedure that calls your function. Set a breakpoint next to the line where the function is called. Click Start Debugging and enter input values in the Edit Parameters dialog.
To track variable values during execution, right-click a variable and select Add Watch.
Press F11 or click Step Into to start debugging and step into the function. Use F10 to step over the function or F11 to go inside and examine logic line by line.
Once finished, use Step Out or switch via the Call Stack pane to return to the main procedure.
Use SQL Complete by Devart, which integrates a powerful debugger into SSMS.
To debug a stored procedure:
In Object Explorer, right-click the procedure, and go to Script Stored Procedure as > EXECUTE To > New Query Editor Window.
Click Step Into or press F11 to start debugging. You should keep pressing Step Into until a new SQL document with the CREATE statement opens.
In the opened script, set breakpoints by right-clicking a line and selecting Insert Breakpoint, or press F9.
Press Alt+F5 to continue execution; use the Breakpoints pane to manage breakpoints.
Right-click variables and choose Add Watch to monitor their values in the Watches pane.
Use F11 to step into code, or F10 to step over called functions or triggers.
What our customers say
Software Engineer
Solutions Provider
Developer